Tharp's Thoughts Weekly Newsletter (View On-Line)
-
Article Why Band Trading Works: Conclusion by Ali Moin-Afshari
-
-
Trading Tip A Funny Thing Happened on the Way to Correction by D.R. Barton, Jr..
-
-
Trading Videos Ken Long and Gabriel Grammatidis Describe Their Trades.
Van Tharp Hand-Picks His Technical Workshop Instructors
Day Trading Systems instructor, Ken Long and Forex Trading instructor Gabriel Grammatidis will teach you everything you need to know about their specified areas of expertise in order to help you become a successful trader. In their workshops, you will learn profitable systems and gain a level of proficiency that will allow you to trade those systems immediately.
If you are considering registering for either Ken Long's Day Trading Systems course, or Gabriel Grammatidis' Forex Trading workshop, watch the two videos at the bottom of this newsletter of each instructor describing their recent trades.
For more information about the Day Trading Systems workshop in August, click here.
For more information about the Forex Trading workshop in September, in Europe, click here.
 Why Band Trading Works Why Band Trading Works
Part 4: Band Based Trading Systems
by Ali Moin-Afshari
View On-line
This is the last article in a four-part series on band trading. In the three previous articles, we reviewed the importance of trends for bands and a few types of price bands. In this article, we will study some guidelines for band-based trading systems which, regardless of the band type, are limited and similar.
Trade Frequency
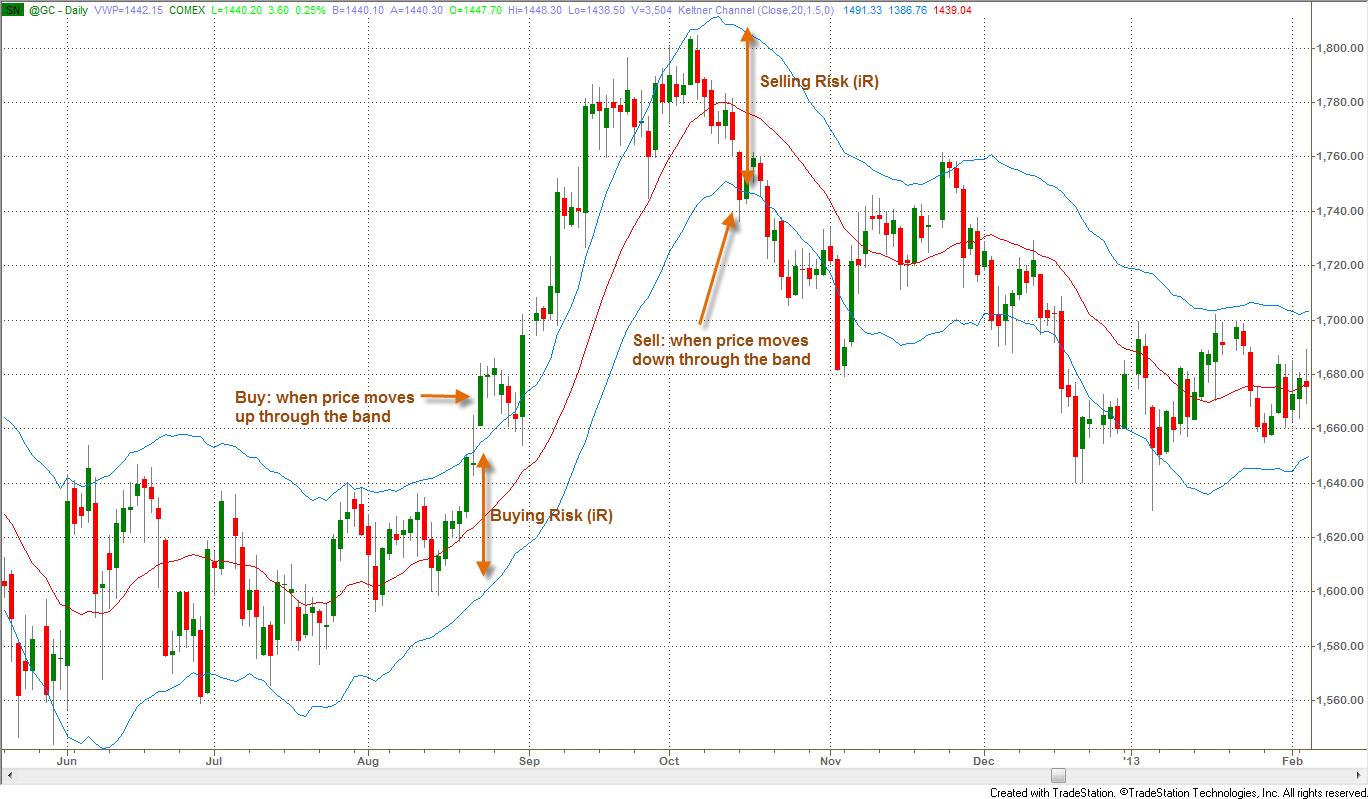
Probably the first and one of the most important decisions to make is how often the system will trade. You must decide whether your system will be in and out of the market or if it will always be in the market (i.e. a reversal strategy) by changing from long to short and back again. If your system will always be in the market, the following rules generally apply:
- Buy: (if short, cover short and go long) when the price closes above the upper band.
- Sell: (if long, close out long and go short) when the price closes below the lower band.
A logical place for your initial stop could be the opposite band which makes the width of the band at entry equal to 1R.
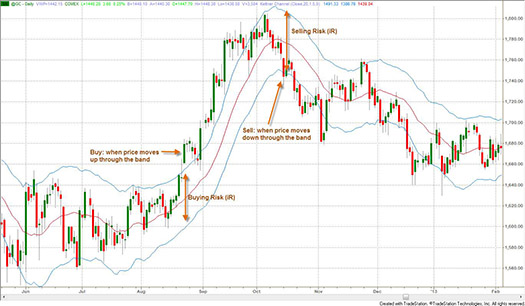
Figure – 1: A standard Keltner Channel plotted on a daily Chart of GC (Gold Futures):
Buy/Sell Rules and initial Risk.
(To see a larger version of this image, click here)
If you prefer to be out of the market at least some of the time, you could exit a position when the price crosses the moving average or another measure of the central trend — long before the price gets to the opposite band. In this case:
- Enter long: when price closes above the upper band. After the price reverses and closes below the MA, exit.
- Enter short: when price closes below the lower band. Exit when price closes above the MA.
In this case, the band is used for entering trades and the center of the band is used for exiting. In low volatility markets, you may need specific rules which allow for exiting positions but not reentering positions on the same day. If either band is penetrated during the next day, it is considered a new signal to go long or short respectively.
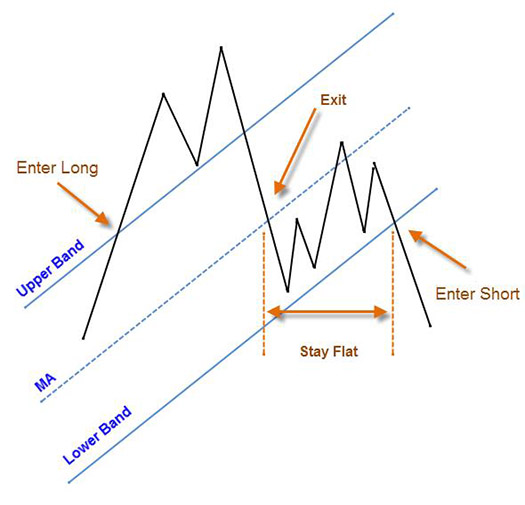
Figure – 2: One Basic Rules for Trading Long or Short Using Bands
This technique allows a trader to reenter in the same direction in case of a false trend change. If a pullback occurs after exiting a trade, an entry at a later date might be possible at a better price. The technique also reduces the order size by half, which could possibly improve the execution price and allows for scaling in. The technique’s disadvantage occurs when the price changes direction and moves so fast that both the exit price and the new entry signal occur on the same day. Immediately reversing the position is better for fast or volatile market types. Therefore, a trader might have two similar systems with different rules for different market types: volatile vs. quiet.
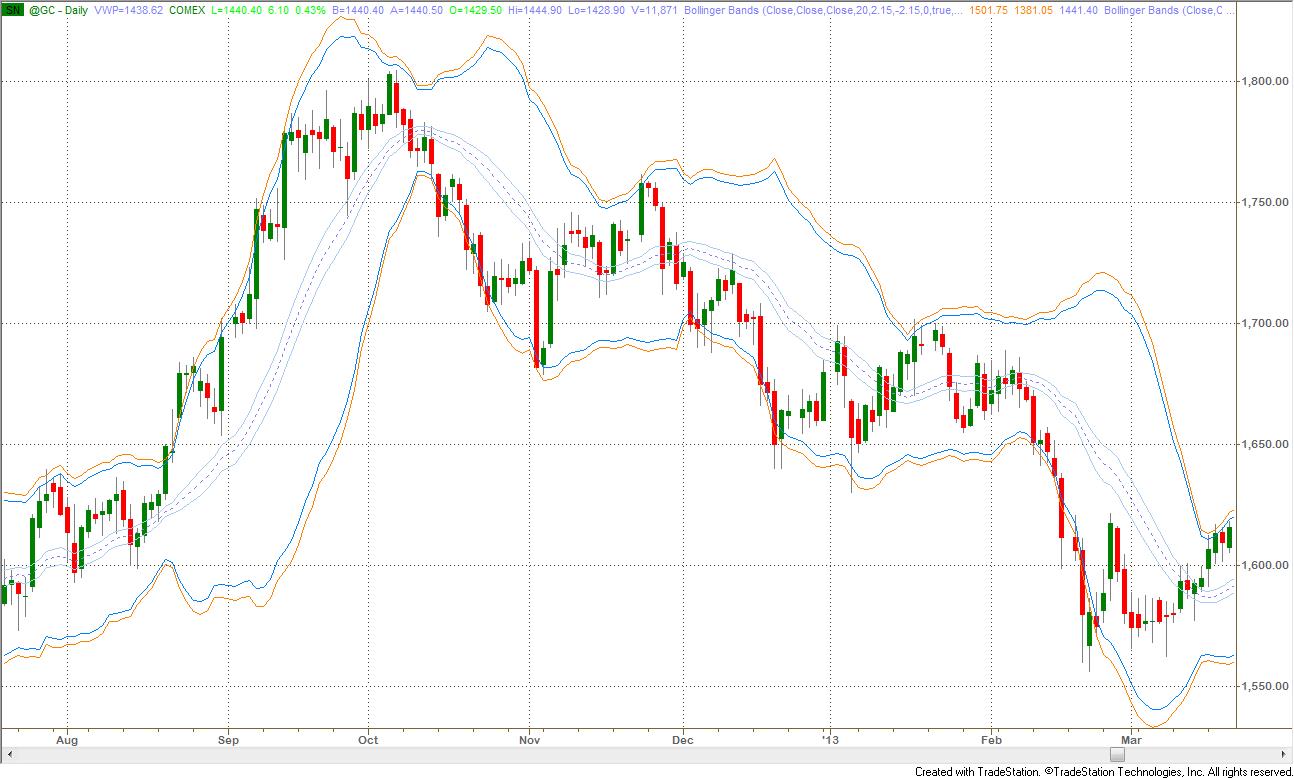
How close is close enough to fire an entry or exit signal? Some traders build a buffer zone around each band and the MA to answer this question. A bar closing anywhere in this zone qualifies and triggers a signal. Trigger zones are particularly useful in automated trading systems and can be built by plotting extra bands at different F (multiplier) values or using a percentage value of the original band and MA. Figure 3 (below) shows this concept:
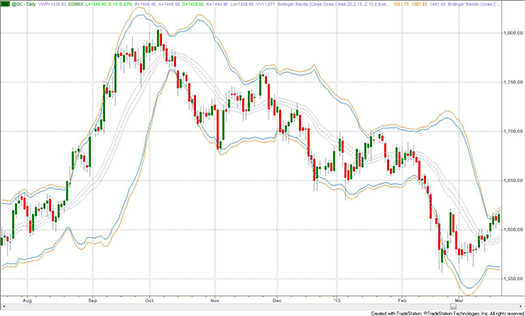
Figure – 3: Trigger Zones on Daily Chart of GC (Gold Futures) with standard Bollinger Bands:
two extra bands are used to create trigger zones around outer bands and the MA.
(To see a larger version of this image, click here)
Timing Better Entries
The objective of timing the entry is to minimize risk in the new position. Many band-based systems, however, enter at a breakout price level. This method usually results in a poor entry (higher risk) and places the trader in the late stage of the trend — often at a point where prices are ready for a pullback. To overcome this problem, consider entering using any of the following rules:
- After a technical price retracement of 50% (or some other value) following a signal.
- When prices move to within a specific risk level relative to a reversal or exit point.
- At the next day’s open following a signal.
- With a delay (1, 2, or n time periods) after the signal is indicated.
- Right before market close when an entry signal has been indicated intraday.
If you are able to enter and exit based on intraday price action, you could add one additional rule:
- Execute only one order intraday: either to liquidate a current position or to enter into a new position.
Better entry prices definitely improve the overall performance, however, an entry rule that is contingent on a technical price level, such as a retracement, may not be triggered and risks missing the entry. I have found that a missed contingent order is usually a missed profitable trade. Therefore, it is better to combine the entry order to include both possibilities, for example:
- Buy/Sell after price retraces (35% x ATR) — OR — Enter on the next bar.
The next step is to test your timing rules and the following two outcomes usually conflict:
- Improved execution.
- Improved performance.
Timing rules usually improve execution but they do not always improve a trading system’s performance for one primary reason — missed trades. In my testing, I have found that certain system rules can get better entry prices by waiting for a pullback. The net result of those better entry prices, however, was missed entries on fast breakouts which decreased the overall system performance. I’m not sure I would have believed that had I not seen it myself.
Filtering Out Noise
Different band types can be combined to create scalping zones and swing trading zones. In this context, scalping means very short trades that may last 3 bars, possibly less, and swing refers to staying in longer trends to capture the majority of the move.
Two bands that work exceptionally well together are SE bands and Keltner channel. Figure 4 shows a one-year daily chart of Google. On this chart I have plotted two bands:
- Keltner Channel: in orange, is used to define a noise channel 1.2 ATR wide. Any price action in this zone will be scalped regardless of prevailing trend. A new scalp trade is entered when price crosses into the Keltner channel and exited when it reaches the opposite band of the Keltner channel. There are three possible scalp trades in Fig. 4 between points 5-6, 7-8, and 9-10.
- SE Bands: in blue, define the swing zone in the direction of the prevailing trend, defined by the linear regression curve in the center. A trade is entered when prices close outside the Keltner channel inside or outside SEB. Possible swing trades are at points 1, 4, 6, the gap up after 8, 10, and the two-bar reversal at 11.
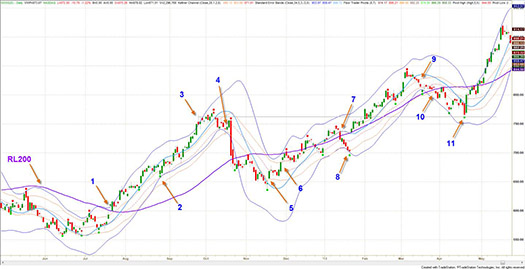
Figure – 4: Swing and Scalp Zones on Daily Chart of GOOG:
a combination of two different bands help filter out noise to maximize trading opportunities.
(To see a larger version of this image, click here)
Any one of the exit and risk management rules above could be used to define 1R and for exits.
If you have been following this series, can you explain why this combination works for filtering noise?
Conclusion
My goal for this series of articles was to provide a general overview of band trading and emphasize the importance of trend and rule-based trading, on which every successful system and trade is built. Due to space limitations, I was able to write about only a few kinds of bands and possible trading techniques utilizing them. We were able to cover some reasonable ground which I hope will help you in your trading.
“Some long for the glories of this world; and some sigh for the Prophet’s Paradise. Ah, take the cash and let the promise go…”
– Omar Khayyam, Persian Poet: The Rubaiyat
About the Author: Ali is an IT architect based in Toronto, Canada. He started trading options in 2006. Despite early success, he realized he needed both a deeper understanding of self and of trading to ensure continued success. Reading Dr. Tharp’s books brought him to Cary to take part in various IITM courses. Ali has spent the past five years studying and perfecting his trading. He is planning to move to full time trading after completing his current technology consulting project.
Trading Education
Van Tharp considers his Oneness Awakening Weekends such a powerful process for transformation he even allows it as an entry point to be considered for Super Trader Program. If you have any interest in powerful personal transformations consider the weekend of August 10-11. The cost is only $195.
| August 10-11 |
Oneness Awakening Weekend
with Van Tharp |
August 16-18 |
Day Trading Systems
with Ken Long
Ken's workshops tend to sell out. Register soon to retain a seat.
|
August 19-21 |
Live Day Trading
with Ken Long
Day Trading Systems is a prerequisite to this course. You'll trade alongside Ken for 2-3 days.
|
October 3-14 |
Peak Performance 101
with Van Tharp |
| Berlin, Germany Workshops |
September 6-8 |
How to Develop a Winning Trading System
with Van Tharp and RJ Hixson
|
September 10-12 |
Blueprint for Trading Success
with Van Tharp and RJ Hixson
|
September 14-16 |
Forex Trading
with Gabriel Grammatidis
|
Register for all 3 and save $800!
|
To see the full schedule, including dates, prices, combo discounts and location, click here.
Trading Tip
 A Funny Thing Happened on the Way to the Correction A Funny Thing Happened on the Way to the Correction
by D. R. Barton, Jr.
View On-line
The financial markets are an endless source of fascination. Like most studies of human behavior, there are many different theories that work some of the time, very few that work most of the time, and none work all of the time.
So, it’s interesting to dig into research and analysis that smart people have found useful. Today, we’ll look at a bunch of charts (some are quite interesting, others are just useful), do very little chatting and talk about some possible paths for the market to take from here — including my take on the most likely path.
In short — the market has had its first meaningful pullback since last November. From the May 22nd high to the June 24th low, the S&P 500 cash index dropped 7.51 percent. Most market technicians would require a ten percent pullback to call the move a correction. By that standard then, the market has not had a correction since June 2012. The interesting thing is that during the recent May-June pullback, the market showed very few signs of fear that the Fed’s free money binge was actually going to end any time soon.
Were the markets skittish? Sure. But by many measures, we didn’t see much fear in the behavior of investors or traders. Whenever we discuss the fear of market participants, immediately my thoughts go to the CBOE Volatility Index ($VIX).
Where’s the Fear?
The $VIX attempts to measure options traders’ estimates of volatility for the next 30 days. Since volatility goes up in times of market trouble, many people call VIX a fear gauge. Let’s look at how it has acted over the last couple of years:
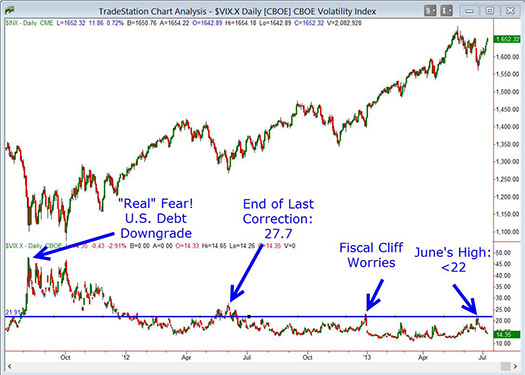
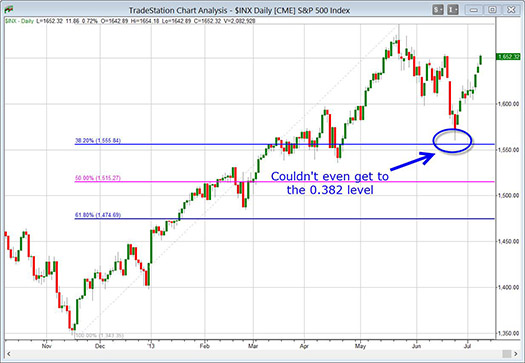
The best the “fear gauge” could manage was a trifling move up off of extremely low levels. In fact, the $VIX has had a series of relatively low highs over the past few years. We see the reason for this reflected in the price movement the S&P 500; in the context of the most recent leg of the bull run, the May-June pullback was a small one. The chart below shows that the market could not even manage a smallest level Fibonacci retracement:
Key Areas Are None the Worse for Wear
Now, we’ll look at a few charts that show how the bounce after the 7.5 percent pullback has been rapid. First, while the other major U.S. indexes have not made it back to their May 22nd highs, the most “risk on” major index is making all-time highs! Here is a chart of the Russell 2000 (or small cap) index pushing into ground that has never been seen before:
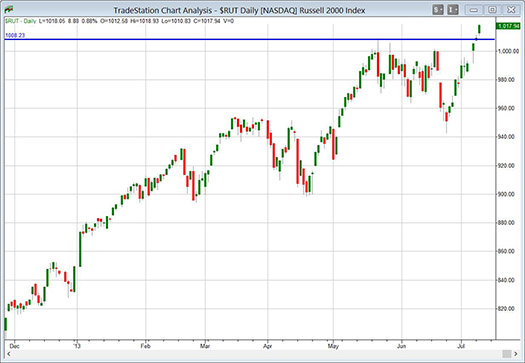
The Russell punched above its May high on Monday and just kept on going. Why would traders and investors jump into the riskiest asset class on the rebound from the recent pullback if they are truly scared of the Fed slowing its cash infusion?
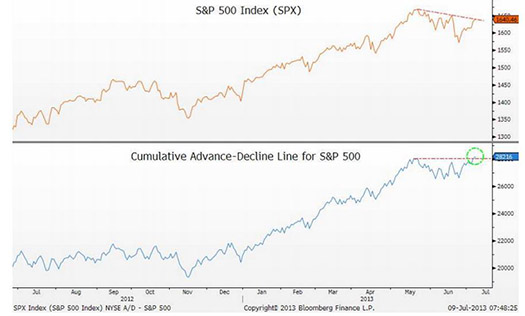
Lastly, let’s look at one of the most misused charts—the cumulative advance-decline (A/D) line. Many people look at this indicator when the market makes new highs but see that the A/D line is not making new highs as well. This is really a misuse of the tool. Since the A/D line only measures how many stocks finished the day in the black, and not by how much, it’s fairly simple math for the market to make a new high but have the A/D line lag.
Now, however, what’s happening is a bit different; the S&P 500 is well below its May highs, while the cumulative A/D line is making fresh new highs. This shows that fewer stocks were dropping during the May-June pullback and that more stocks are participating in the post-pullback rally. Let’s take a look at an A/D chart (courtesy of Jonathan Krinsky at Miller Tabak & Company):
Forecast: Highs Ahead? Partly Cloudy
From an analysis perspective, the technical picture is shaping up for the other major indexes (S&P, Dow, and NASDAQ) to continue their bull run and test or even exceed the May highs.
There are, however, two strong mitigating factors out there. The first is the fact that the markets are currently hyper-sensitive to any whisper of a reduction in central bank monetary infusion. Whether from the U.S., Europe, Japan or other venue, if there is any semi-reputable hint of central bank tapering, all bets are off.
The second issue is the amazing divergence between the relative health of the U.S. stock markets and the various “degrees of bad” in almost all other world markets. These range from the anemic performance of Europe to the downright full-fledged retreat in almost all other world markets (the emerging markets, especially the BRIC countries). At some point, the poor economic and stock market conditions of the global marketplace will start to weigh on the U.S. equity market performance. But as long as Dr. Bernanke and his fellow central bankers keep the asset purchase party going, that reckoning could be a long time coming.
As always, your comments and feedback are welcome! Please send your thoughts to drbarton “at” vantharp.com
Great Trading,
D. R.
About the Author: A passion for the systematic approach to the markets and lifelong love of teaching and learning have propelled D.R. Barton, Jr. to the top of the investment and trading arena. He is a regularly featured guest on both Report on Business TV, and WTOP News Radio in Washington, D.C., and has been a guest on Bloomberg Radio. His articles have appeared on SmartMoney.com and Financial Advisor magazine. You may contact D.R. at "drbarton" at "vantharp.com".
Disclaimer
Trading Videos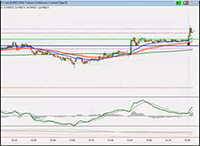
In this ten minute video, Forex Trading Workshop instructor Gabriel Grammatidis provides a thorough description of a trade from one of the systems he trades and teaches. Rather than a currency pair, however, Gabriel used the same system to trade the DAX index. He goes through possible entry points, setting profit targets, some exit rules and the process of converting a successful day trade into a low risk swing trade.
Click here to watch the video.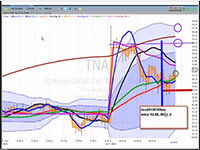
In this five minute video, Day Trading Systems instructor Ken Long details a series of RLCO trades from July 9, 2013 that took advantage of the low volatility and rising market. There was one primary trend for the day which Ken was in and out of several times for about a +4R day.
Click here to watch the video.
Matrix Insight
Dear Dr. Tharp,
I would like to preface my submission with the statement that Trading Beyond the Matrix is the first one of your books that I have read. I read it in April, 2013 when I came across it at my local library. I have since purchased my own copy.
I think that in order to provide the proper context to my selection I must first provide a brief description of myself and my particular situation.
By most standards, I think I would be considered reasonably smart. I have a Ph.D., my work has been published in peer reviewed journals and I am listed as an inventor on different patents within my field of organic/medicinal chemistry. Outside of my chemistry comfort zone, I picked up new skills to help advance my trading. I took an online course in C# so that I could write custom code to back test ideas. To gain more statistical data on back tested ideas, I imported data bars into excel spreadsheets. I then learned to develop the logic and write the code to keep track of price excursions as a function of initial risk taken.
I consider myself to be dedicated to my trading. I treated my trading as a business and set up a husband/wife partnership in the beginning of 2013. I have diligently documented every trade carried out under the partnership in a trading diary to learn from my mistakes. Additionally, I was getting up at 2:45 AM so that I could utilize the added liquidity of the UK market to trade the YM contract outside of the working hours of my full-time job.
I was using a trading system that a close friend and mentor is currently using to make a living by trading. Yet, despite the advantages of being smart, dedicated and using a proven profitable system, I was failing miserably as a trader. Looking back at my diary, I could clearly see where I was failing in my execution. I initially wrote that off as lack of sleep. Considering that my initial wake up time of 2:45 AM had to be moved up to 1:45 AM from 3/11/13 to 3/29/13, since the European daylight savings time switch lagged the US day light saving time switch, it did not seem like a far stretch that my poor execution was due to a lack of sleep. However, once the times synced back up, my body was fully adjusted to my new sleep schedule. Yet I still kept making execution errors and losing money.
While reading Trading Beyond the Matrix has led me to change several things about how I approach my trading, the single most important principle that I took away from the book was that I need to find or develop a system that fits me. I now realize that the system I was using was designed for someone else’s beliefs, parts, strengths, weaknesses, values and edges not mine.
The result of discovering this principle has had a profound impact on both my trading and my life. This principle led me to: 1) complete the Sedona Method course so that I could be more effective at releasing any charged emotions that might come up as I work on my trading psychology (as a side note, my wife took the Sedona course with me and it has changed our lives for the better), 2) started the process of identifying my parts and beliefs, 3) started the Parts Negotiation exercise (Oh, and they are conflicted) and the Nine Steps to Mastering Yourself exercise describe in the Matrix book, and 4) started the Peak Performance Home Study Course in late June. I think I read that the Parts Negotiation and Nine Steps to Mastering Yourself exercises were part of the Home Study Course, so I have temporarily put those exercises on hold as I expect to get to them as I work through the Home Study Course. Lastly, experiencing the work that was required for items 2 and 3 ultimately led me to discontinue trading so that I can solely focus on my trading psychology.
With my best regards,
Joe P.
Recently, we wrote to you to tell you about a new contest. We want to hear about the one most profound insight that you got from reading Van's new book, Trading Beyond the Matrix, and how it has impacted your life. If you haven't purchased Trading Beyond the Matrix yet, you can do so here. When you are ready to tell us about your insight, send an email to van@vantharp.com. We are looking forward to hearing from you. If we pick your submission we will share it this newsletter.
Ask Van...
Everything we do here at the Van Tharp Institute is focused on helping you improve as a trader and investor. Consequently, we love to get your feedback, both positive and negative!
Click here to take our quick, 6-question survey.
Also, send comments or ask Van a question by clicking here.
Back to Top
Contact Us
Email us at suggestions@vantharp.com
The Van Tharp Institute does not support spamming in any way, shape or form. This is a subscription based newsletter.
To change your e-mail Address, e-mail us at info@vantharp.com.
To stop your subscription, click on the "unsubscribe" link at the bottom left-hand corner of this email.
How are we doing? Give us your feedback! Click here to take our quick survey.
800-385-4486 * 919-466-0043 * Fax 919-466-0408
SQN® and the System Quality Number® are registered trademarks of the Van Tharp Institute
Be sure to check us out on Facebook and Twitter!
 
Back to Top |