Tharp's Thoughts Weekly Newsletter (View On-Line)
-
Article Market Update, Market Condition: Neutral Normal by Van K. Tharp, Ph.D.
-
-
Trading Tip January 2014 SQN Report by Van K. Tharp, Ph.D.
-
Mailbag The Definitive Guide to Position Sizing Testimonial
Learn Three Proven Forex Systems — Then Trade Them Live
This March, Gabriel Grammatidis is presenting his Forex Trading Workshop where you will learn three proven trading systems. Then, for the first time, we are offering you the option to stay on for two days of Live Trading with Gabriel where you can continue learning the systems in a hands on environment — the live markets.
Click the link below to watch a new video from Gabriel on one of his systems, 3TMA.

For more information on these and other workshops, click here.
Article
Market Update for the Period Ending January 31, 2014
Market Condition: Neutral Normal
by Van K. Tharp, Ph.D.
View On-line
I always say that people do not trade the markets; they trade their beliefs about the markets. Consequently, I'd like to point out that these updates reflect my beliefs. I find the market update information useful for my trading, so I do the work each month and am happy to share that information with my readers.
If, however, your beliefs are not similar to mine, then this information may not be useful to you. If you are inclined to perform some sort of intellectual exercise to prove one of my beliefs wrong, simply remember that everyone can usually find lots of evidence to support their beliefs and refute others. Know that I acknowledge that these are my beliefs and that your beliefs may be different.
These updates are in the first issue of Tharp's Thoughts each month. This allows us to get the closing month's data. These updates cover 1) the market type (first mentioned in the April 30, 2008 edition of Tharp's Thoughts and readable on our web site), 2) the five-week status on each of the major U.S. stock market indices, 3) our four star inflation-deflation model plus John Williams' statistics, and 4) the movement of the dollar. I now report on the strongest and weakest areas of the overall market in a separate SQN®Report. I may come out with that report twice a month if there are significant market changes.—Van K. Tharp
Part I: Commentary—The Big Picture
The bull market may be over or we might just be in dangerous territory. On January 31st, our market SQN® score was Bull Quiet. But two strong downtrend days later it was Neutral Normal. It is time to be cautious.
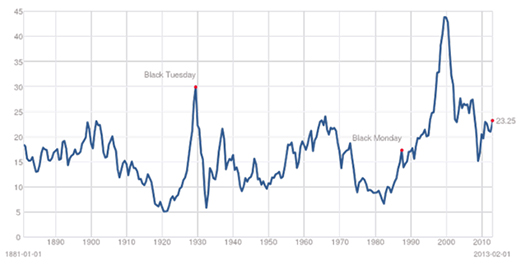
One of my favorite newsletter writers, Richard Russell, has been writing a regular market commentary since the 1950s. In late January, he said he thought the final phase of the primary bear market that began in 2000 might be starting its final down leg and that this move would be much worse than 2008. Because the market is not even bear or volatile, I’m not predicting that yet but I do think it is time to be cautious. The final phase of a bear market is where the S&P goes to a single digit PE and we see a yield above 5% for the index. That is a huge drop. The current P.E. ratio is shown in the chart below at 23.25.
The Federal Reserve has announced it has tapered QE3 two times for $10 billion each. And who knows what Janet Yellon will do. My advice is to be careful.
Let’s look at the state of the United States chart courtesy of the debt clock.
The State of the United States |
Month Ending |
National Debt |
Federal Tax Revenue |
Federal Spending |
Trade Deficit |
Debt Per Family |
Unfunded Liabilities |
Workforce (taxpayers) |
People supported by them |
July 31 2012 |
$15.93 trillion |
$2.364 trillion |
$3.632 trillion |
$810 billion |
$684,405 |
|
|
|
Dec 30 2012 |
$16.42 trillion |
$2.452 trillion |
$3.540 trillion |
$740.7 billion |
$732,086 |
|
|
|
July 31, 2013 |
$16.89
Trillion |
$2.73
trillion |
$3.535 trillion |
$703 billion |
$748,458 |
|
115.2 million |
109.9
95.4% |
Aug 31, 2013 |
$16.92 trillion |
$2.76 trillion |
$3.541 trillion |
$693 billion |
$748,889 |
|
114.2 million |
109.6
95.6% |
Sep 30, 2013 |
No data |
No data |
No data |
No data |
No data |
Unfunded Liabilities |
No data |
No Data |
Oct 31, 2013 |
$17.13 trillion |
$2.81 trillion |
3.516 trillion |
$685 billion |
$752,131 |
No data |
114.6 million |
109.0
95.1% |
Nov 30, 2013 |
$17.21 trillion |
$2.82 trillion |
$3.480 trillion |
$690 billion |
$752,510 |
$126.8 trillion |
114.8 million |
109.1
95.0% |
Dec 31, 2013 |
$17.27 trillion |
$2.84 trillion |
$3.480 trillion |
$692 billion |
$751,294 |
$127.2 trillion |
115.0 million |
108.5
94.3% |
Jan 31, 2014 |
$17.32 trillion |
$2.84 trillion |
$3.494 trillion |
$676 billion |
$752,026 |
$127.7 trillion |
115.2 million |
108.8
94.4% |
The usdebtclock.org website publishers have changed their site a little to include unfunded US liabilities. Right now our total unfunded liabilities are $127.7 trillion with most of that being Medicare and prescription drug liability with respective totals at $88 trillion and $22 trillion. The Social Security unfunded liability is only a little less than our total debt at $16.8 trillion.
The US population remains at 317 million people with taxpayers standing at 115.2 million. The oldest Boomers continue to leave the work force and retirees now stand at 47.1 million. Disabled people collecting social security stands at 14.3 million while food stamp recipients total 47.4 million (with all three being up over the last month) so that’s 108.8 million people that are supported either by the government or the 115 million taxpayers. But really about 11.5 million taxpayers pay 90% of U.S. taxes. This means that 11.5 million workers are supporting 108.8 million other people through the government. Do these numbers add up to you? Do they seem sustainable?
Part II: The Current Stock Market Type Is Neutral Normal
Each month, I look at the market SQN® score for the daily percent changes in the S&P 500 Index over 200, 100, 50 and 25 days. Normally, I give the market type for last day of the month or the Friday at the end of the month. On Friday, Jan. 31, the market type was Bull Quiet but I want to give you the February 3rd data, because everything has changed in the last few days. The 200-day market SQN score is Bull Normal but our primary measure, the 100-day market SQN score has moved to Neutral Normal. The 50-day market SQN score is now Bear Normal, and the 25-day market SQN score is Strong Bear Normal. Thus, the bull may be over.
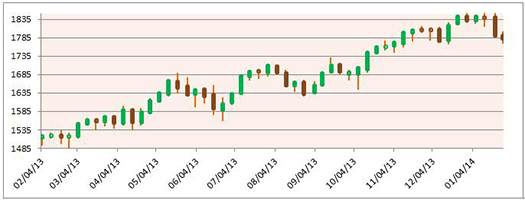
The first chart shows the weekly price bars for the S&P 500 with the last bar ending on Friday, January 31:
(click here to see the three following charts stacked and aligned)
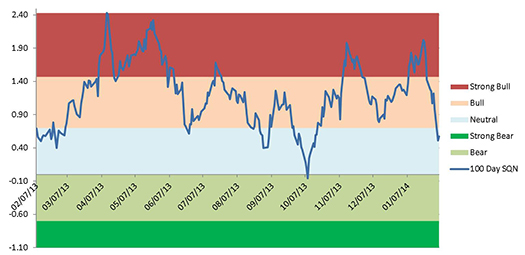
The 100-day market SQN score shown below ends on February 3 so you can see how the market type has changed status recently. Last month, the market started in bull range, then moved into strong bull in mid-January, back through bull in the last two weeks and finally into neutral territory in the last few days:
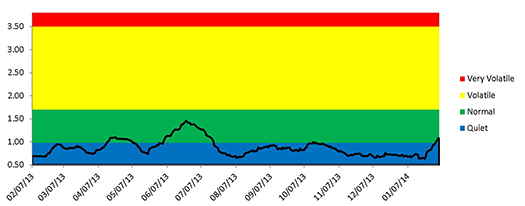
The last chart is our volatility chart. You can see that it’s been a long time since the market has been in any way volatile. But we have now moved from quiet to normal volatility. Again, you can see the move in the last few days from quiet to normal. This is no longer buy and hold territory.
(click here to see the three previous charts stacked and aligned)
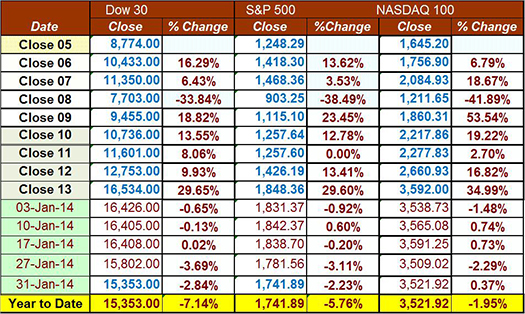
Below is a chart of the weekly changes in the three major US Indices. As you can see, all three indices were up substantially last year with double digit gains. Was your performance as good as the major indices in 2013? For 2014, however, all three indices are down so far.
Part III: Our Four Star Inflation-Deflation Model
In the simplest terms, inflation means that stuff gets more expensive, and deflation means that stuff gets cheaper. There’s a correlation between the inflation rate and market levels, so the inflation rate can help traders understand big-picture processes.
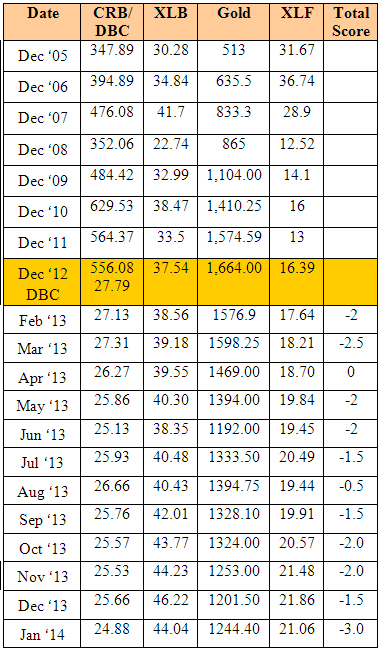
Looking back at the data over the most recent two-month and six-month periods for the model components provides the current month’s score, a deflationary -3.
Month |
CRB2/
DBC2 |
CRB6/
DBC6 |
XLB2 |
XLB6 |
Gold2 |
Gold6 |
XLF2 |
XLF6 |
Total Score |
|
Lower |
Lower |
Lower |
Higher |
Lower |
Lower |
Lower |
Higher |
|
Jan-14 |
|
-1 |
|
-1/2 |
|
-1 |
|
-1/2 |
-3 |
Again, it was another month where the deflationary forces seem to be winning. During 2013, we had one inflationary month, 10 deflationary months, and one month being zero. In fact, the last 8 straight months have been deflationary.
Part IV: Tracking the Dollar
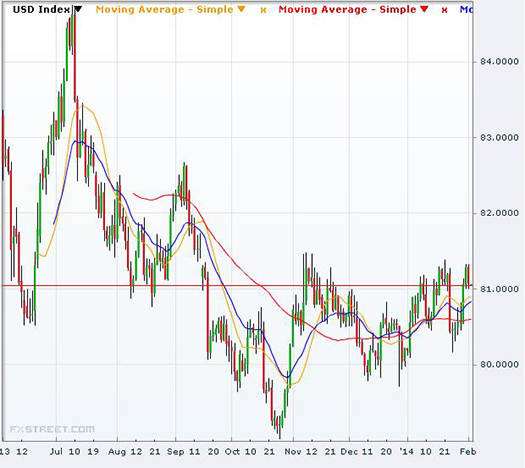
Since it peaked in July, the USD had been on a downtrend last summer and fall. The large drop came shortly after Fed Reserve Chairman Bernanke announced the continuation of the QE program. With QE 3 being tapered off now, however, the dollar is showing some strength.
Below is a chart of the US Dollar Index. My recurring joke, which unfortunately is too often true, is that the dollar falls when Van travels overseas. I'm going to Australia in March and the tradition is the dollar falls, at least against the Aussie dollar, while I'm there.
General Comments
Longer term, fiat currencies with nothing behind them propel the big picture. Short term, multiple markets continue to offer plenty of opportunities to prepared traders. The keys are awareness, preparation, and execution.
These monthly market updates are not intended for predictive purposes; rather, they’re intended to help traders decide which of their trading systems should work best in the current market conditions. In bear markets—which are almost always volatile by nature—shorter-term strategies, and those that allow going short, tend to work better than long-only or intermediate/longer-term systems.
Which of your trading systems fit this current market type? Of course, this question implies that you have multiple trading systems and that you know how they perform under various market conditions. If you haven't heard of this concept or the other concepts mentioned above, read my book, Super Trader, which covers these areas and more, so that you can make money in any kind of market condition.
Crisis always implies opportunity. Those with good trading skills can make money in this market—a lot of money. There were lots of good opportunities in 2013, and many more to come in 2014. Did you make money? If not, then do you understand why not? The refinement of good trading skills doesn't just happen by opening an account and adding money. You probably spent years learning how to perform your current job at a high skill level. Do you expect to perform at the same high level in your trading without similar preparation? Financial market trading is an arena filled with world-class competition. Additionally, and most importantly, trading requires massive self-work to produce consistent, large profits under multiple market conditions. Prepare yourself to succeed with a deep desire, strong commitment and the right training.
About the Author: Trading coach and author Van K. Tharp, Ph.D. is widely recognized for his best-selling books and outstanding Peak Performance Home Study Program—a highly regarded classic that is suitable for all levels of traders and investors. You can learn more about Van Tharp at www.vantharp.com. His newest book, Trading Beyond The Matrix, is available now at matrix.vantharp.com.
Back to Top
Trading Education
Why aren’t you trading Forex already?
Have you seen the headlines about currency rate fluctuations? Does trading Forex seem different enough from your current market that you've stayed away from it?
Join us in March when Gabriel Grammatidis teaches his Forex Trading Workshop, you will learn valuable information no matter what level of knowledge you have regarding Forex.
Click here to see the full workshop schedule or to register.
Back to Top
Trading Tip
January 2014 SQN® Report
by Van K. Tharp, Ph.D.
There are numerous ETFs that now track everything from countries, commodities, currencies and stock market indices to individual market sectors. ETFs provide a wonderfully easy way to discover what’s happening in the world markets. Consequently, I now apply a version of my System Quality Number®(SQN®) score to measure the relative performance of numerous markets in a world model.
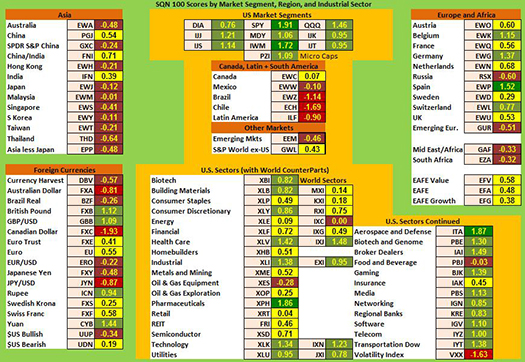
The Market SQN score uses the daily percent change for input over a 100-day period. Typically, a Market SQN score over 1.45 is strongly bullish and a score below -0.7 is very weak. The following color codes help communicate the strengths and weaknesses of the ETFs in this report:
- Green: ETFs with very strong Market SQN scores (0.75 to 1.5).
- Yellow: ETFs with slightly positive Market SQN scores (0 to 0.75).
- Brown: ETFs with slightly negative Market SQN scores (0 to -0.7).
- Red: Very weak ETFs that earn negative Market SQN scores (< -0.7).
The world market model spreadsheet report below contains most currently available ETFs; including inverse funds, but excluding leveraged funds. In short, it covers the geographic world, the major asset classes, the equity market segments, the industrial sectors and the major currencies.
World Market Summary
Each month, we look at the equities markets by segment, region and sector. I created this report using January 31st data — before the large down days this week. We are using the end of the month data for consistency with other reports. Remember that the market type just moved from Bull Quiet into Normal Neutral as of Feb 3rd.
On January 31st, all US equity sectors were green. Europe is green and yellow, with only Russia and Emerging Europe being brown. Spain is the strongest European country. In Asia, however, everything is now brown except for China and India which are neutral (yellow). And in the Americas (other than the US)everything is either red or brown except for Canada which is nearly yellow.
In other words, the US equity markets are among the strongest in the world and we just called them as moving to neutral from bull. An interesting big picture is emerging.
(to see a larger version of this chart, click here)
In currencies, on the other hand, performance is mixed. The Pound, the Rupee, and the Yuan are showing some strength. Three currencies are red or very weak: the Aussie Dollar, the Canadian Dollar, and the Japanese Yen. The Canadian dollar is the new worst performer. Two currencies are very strong — the Chinese Yuan and the British Pound.
From a sector standpoint, we see again mostly green and some yellow. Pharmaceuticals are the only dark green area. Health Care, Industrials, and Technology have SQN scores over 1. Utilities, Biotech, Building Materials , and Consumer Discretionary are light green. The only negative area is Oil and Gas Equipment. REITs and utilities have both moved up from the bottom.
Commodities, Real Estate, Debt, Top and Bottom Lists
The next table shows real estate, debt instruments, commodities and the top and bottom ETFs for the past 100 days.
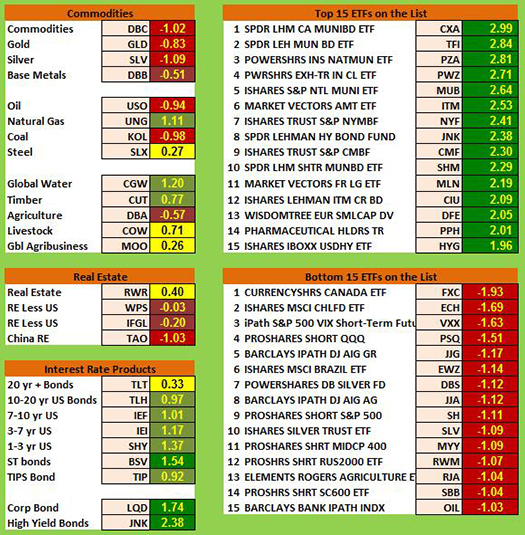
Global water, natural gas, and timber are strong among the commodities, however, there are many negative areas too. Natural gas, coal, timber, and global agribusiness are all light green. Metals, however, are still pretty weak. US real estate is neutral while Chinese real estate seems weak.
All of the interest rates sectors are suddenly strong, except for long-term bonds which are fairly neutral. Money is fleeing to its dangerous standby position of interest rate products. Interest rates can't get much lower, but that situation is capable of devastating those who flee to this area.
In the top market SQN scoring ETFs, we have 14 groups with SQN scores above 2.0. And most are starting to look like debt-based ETFs, especially municipal bonds.
We have no negative ETF below -2.0 with the Canadian dollar looking like the worst.
Summary
So let’s look at our overall summary of the ETF picture and see what trends are happening. Last month I was somewhat surprised at the continued bullishness though now that is fading. We now have 57.3% bullish and 20.3% bearish. That’s slightly weaker than last month but not by much.
Date |
Very Bullish |
Bullish |
Neutral |
Bearish |
Very Bearish |
|
> 1.5 |
0.75 - 1.5 |
0 - 0.75 |
0 - -0.7 |
< - 0.7 |
January 31st |
27.1% |
39.6% |
20.7% |
6.4% |
4.7% |
February 28th |
10.3% |
45.2% |
24.4% |
11.9% |
7.5% |
March 31st |
39.2% |
25.5% |
19.1% |
9.0% |
6.4% |
April 30th |
49.1% |
21.1% |
14.8% |
8.0% |
6.2% |
May 31st |
29,2% |
23.6% |
19.9% |
12.3% |
14.2% |
June 30th |
2.1% |
31.0% |
23.2% |
22.0% |
20.9% |
July 31st |
8.2% |
33.5% |
29.0% |
13.3% |
15.2% |
August 30th |
1% |
15% |
46.4% |
19.3% |
17.5% |
Sept. 30th |
1% |
13.8% |
42.3% |
23.0% |
19.1% |
Nov. 1st |
13.3% |
48.3% |
21.8% |
12.5% |
3.3% |
Dec 1st |
14.6% |
42.7% |
24.2% |
13.3% |
4.3% |
Dec 31st |
19.3.% |
45.5% |
22.0% |
11.3% |
2.9% |
Jan 31st |
8.0% |
49.3% |
20.7% |
12.7% |
7.6% |
What's Going On?
Bottom line: the market (ie S&P 500) has just moved out of Bull Quiet to Neutral Normal. The rest of the world looks weak. The fundamentals are terrible. Money is moving out of fear and into safety, mainly municipal bonds.
Yes, the fundamentals are terrible, but the market says be “long” US stock. This is now becoming a market for just short term traders. Until next month, this is Van Tharp.
The markets always offer opportunities, but to capture those opportunities, you MUST know what you are doing. If you want to trade these markets, you need to approach them as a trader, not a long-term investor. We’d like to help you learn how to trade professionally because trying to navigate the markets without an education is hazardous to your wealth.
All the beliefs given in this update are my own. Though I find them useful, you may not. You can only trade your own beliefs about the markets.
Mailbag
Mailbag
I recently purchased "The 2nd Edition of the Definitive Guide to Positing Sizing Strategies" and am very pleased. Very pleased indeed. I have been trading for about 5 years. Having gone to mildly profitable, I had been looking for material on money management for quite a while. At least from a pure skills perspective, I had figured that money management and position sizing is what I needed to go from profitable to making more substantial gains. Have you noticed how everyone seams to agree that position sizing (money management) is so important yet very little accessible information is out there. Having searched far and wide I finally hit on this gem of a book. Having ordered it I can say that I am not disappointed.
I'll split my testimonial into two parts: first the service and then the book.
When I saw that the 1st book was not in stock I sent an email to the Van Tharp Institute inquiring about getting a copy. I was informed that the 2nd edition was under way and would be available shortly and that I was to be put on a list to be notified. A few weeks later, as promised I was contacted after which I put my order in. I opted for the regular shipping and after several weeks on rainy Monday I found the a box lying on my office desk. It was immediately apparent that water had made its way into the package. You can imagine what that did. The pages got bent out of shape and the cover was already turning yellow. Regardless of that, I could not hold myself and started reading. This book is the type that one reads many times over and over and uses it for reference while working on developing ones trading strategy. It is going to serve me for quite a while and I was concerned with how the wet copy would hold up. So in the meantime I sent an email to Van Tharp customer services explaining what had happened and if there was something they could do. An email response did not take long to arrive expressing sorry for my inconvenience and that a new complementary copy would be sent to me free of charge. No questions asked. The next day a new copy had been shipped — nice!
Now for the book. In short, it is a gold mine. When I look at all the skills involved in trading, the subject of money management is perhaps the most complicated of all the other aspects and getting it right is really important. It ties in everything — your system, yourself, your account, your objectives — all of these influence position sizing so it's no wonder it's so complicated to make sense of it all and get a working balance.
The book is well written, it explains the concepts, uses examples and provides a framework which the average person can wrap ones head around and actually implement. It might take a few readings and work, but nothing in there requires a Ph.D. in math and can be seen as a guide. The subject is covered in a very wide manner and explains in practical terms the steps to take, the pitfalls to watch out for and provides the rules of thumb that only come from experience. I get a real sense that a lot of care went into making the book and that nothing was spared.
If you are an intermediate or advanced trader looking to expand your skills in the area of position sizing I recommend this book and hope you enjoy it as much as I do.
Onn
 New, Second Edition, The Definitive Guide To Position Sizing Strategies is Now Available! New, Second Edition, The Definitive Guide To Position Sizing Strategies is Now Available!
The name Van Tharp is often synonymous with the term Position Sizing. In fact, Van invented and coined the term. It's one of the most important concepts that a trader can understand, yet so often, traders misjudge how critical a role it plays in your results. To help traders, Van set out to create the definitive compilation of this weighty subject some years back. Based on the feedback from the book’s first edition readers, he was quite successful and now he is releasing the second edition.
If you think your systems are more important than your position sizing strategies in meeting your objectives, we strongly encourage you to study this book. Understanding position sizing topics will have more impact on your trading results than any other single “technical” subject. After reading it, you'll understand why many traders keep the book close by as desk reference.
It's a substantial book, well worth its $249 price tag.
Learn More | Order Now
Ask Van...
Everything we do here at the Van Tharp Institute is focused on helping you improve as a trader and investor. Consequently, we love to get your feedback, both positive and negative!
Click here to take our quick, 6-question survey.
Also, send comments or ask Van a question by clicking here.
Back to Top
Contact Us
Email us at suggestions@vantharp.com
The Van Tharp Institute does not support spamming in any way, shape or form. This is a subscription based newsletter.
To change your e-mail Address, e-mail us at info@vantharp.com.
To stop your subscription, click on the "unsubscribe" link at the bottom left-hand corner of this email.
How are we doing? Give us your feedback! Click here to take our quick survey.
800-385-4486 * 919-466-0043 * Fax 919-466-0408
SQN® and the System Quality Number® are registered trademarks of the Van Tharp Institute
Be sure to check us out on Facebook and Twitter!
 
Back to Top |


