Tharp's Thoughts Weekly Newsletter (View On-Line)
-
Article Monthly Market Condition Update: Bull Normal by Van K. Tharp
-
-
-
Trading Tip February 2014 SQN Report by Van K. Tharp, Ph.D.
-
It's Time to Register for Spring 2014 Workshops
March: Learn three forex trading systems and experience trading them live. This is a unique forex workshop that combines the skill and knowledge of an experienced Forex trader with the core principles of Tharp Think.
April-May: Three back-to-back events. We only offer How to Develop A Winning Trading System and Blueprint for Trading Success once each year in the US. Plus, this year we are offering something new, a Trading in a Bear Market workshop. You can take all three with only one trip to NC.
For more information on these and other workshops, click here.
Note: If you are located in or near Sydney, Australia, there is still time to register for the workshops being held there, beginning on Friday. For more information, click here.
Article 
Market Update for the Period Ending February 28, 2014
Market Condition: Bull Normal
by Van K. Tharp, Ph.D.
View On-line
I always say that people do not trade the markets; they trade their beliefs about the markets. Consequently, I'd like to point out that these updates reflect my beliefs. I find the market update information useful for my trading, so I do the work each month and am happy to share that information with my readers.
If, however, your beliefs are not similar to mine, then this information may not be useful to you. If you are inclined to perform some sort of intellectual exercise to prove one of my beliefs wrong, simply remember that everyone can usually find lots of evidence to support their beliefs and refute others. Know that I acknowledge that these are my beliefs and that your beliefs may be different.
These updates are in the first issue of Tharp's Thoughts each month. This allows us to get the closing month's data. These updates cover 1) the market type (first mentioned in the April 30, 2008 edition of Tharp's Thoughts and readable on our web site), 2) the five-week status on each of the major U.S. stock market indices, 3) our four star inflation-deflation model plus John Williams' statistics, and 4) the movement of the dollar. I now report on the strongest and weakest areas of the overall market in a separate SQN® Report. I may come out with that report twice a month if there are significant market changes.—Van K. Tharp
Part I: Commentary—The Big Picture
Last month, the market started crashing and went into neutral territory. So instead of calling the market bull quiet, I reported that the market had moved to neutral territory. And that, of course, was the bottom. We had three days of neutral for the Market SQN® score. Since that time, the market has been moving up. We have a new leader at the Fed, Janet Yellen, and she is probably going to do whatever she can to stimulate the economy. No leader of the Fed wants the market to collapse on their watch, although Janet may be the unlucky one. Bottom line: the fundamentals of our economy are horrible but the Fed is pumping money into the banks, who are not lending it, but investing it into the markets.
I also noticed a USA Today article talking about the numbers of listed stocks. Since 2000 the number of listed stocks has fallen dramatically. I actually expected this to happen to mutual funds (and it has, but investment companies keep developing new ones to sell to the public). In addition, not many new stocks are being listed.
In 2000 there were 6,639 listed stocks. In 2012 that number had dropped, according to USA Today, to 3,667. In 2012 there were only 128 new stocks listed, however, this has changed somewhat by the large number of ETFs available now. In 2000 there were 102 ETFs, in 2012 there were 1,337, and in early 2014, that number is now just above 1,500. This growth has occurred despite the fact that ETFs are also closed down with some regularity. Of the 500 or so that we follow in our world model, we usually have to eliminate 3-4 each month.
What does this mean? Well, fewer stocks means fewer places for money to flow and so new money printed by the Fed probably has a bigger stimulation effect when it’s injected directly into the market.
Let’s look at the state of the United States chart courtesy of the debt clock. One month was missed while I was gone last year, but it’s not that important as the trends are obvious.
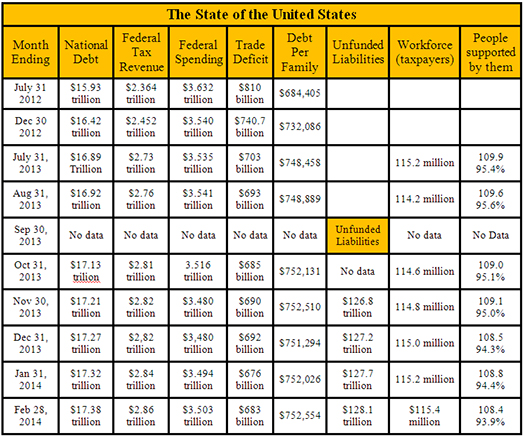
Right now our total unfunded liabilities are $128.1 trillion (with most of that being Medicare and prescription drug liability) at $88.8 trillion and $22.3 trillion, respectively. Social security unfunded liability is only a little less than our total debt at $16.9 trillion.
Today, our official debt is over $17 trillion and it’s now going up almost a trillion dollars every year. Furthermore, the debt situation is so bad that the Federal Reserve has had to drive short term interest rates to almost zero and long term rates to very low numbers. This is killing the U.S. dollar and interest rates have nowhere to go but up. In fact, betting on eventual higher interest rates is about as close to a certain bet (long term) as you could ever make.
According to the debt clock, our official national debt stands at $17.38 trillion, up $60 billion from the prior month. The US population remains at 317.6 million with taxpayers standing at 115.4 million. The Boomer retirement wave has begun and retirees now stand at 47.2 million. Disabled people collecting social security stands at 14.3 million, while food stamp recipients total 46.9 million so that’s 108.7 million people that are supported by the government (or the 115.4 million taxpayers). But really about 11.5 million taxpayers pay 90% of U.S. taxes. This means that 11.5 million workers are supporting 108.5 million other people through the government. Do these numbers add up to you? Do they seem sustainable?
Part II: The Current Stock Market Type Is Bull Normal
Each month, I look at the market SQN® score for the daily percent changes in the S&P 500 Index over 200, 100, 50 and 25 days. For our purposes, the S&P 500 Index defines the market.
The market type for the 200 day period, as well as the 100 and 50 day periods are all Bull Normal, however, the 50 day market only just turned Bull Normal. The 25 day market type just turned from Bear Normal to Neutral Normal. Market volatility is normal and close to the quiet range so this market is not very dangerous right now.
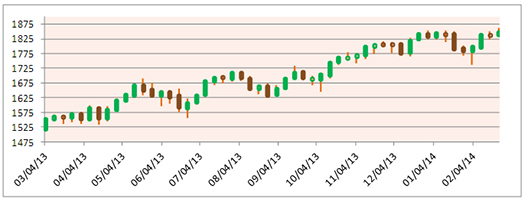
You can see the price recovery during February on the chart below for the S&P 500—
(To see the three following charts stacked and aligned, click here)
The following chart has the market SQN score for the 100 day period. You can see that 2013 has been mostly bullish with a little time spent in neutral and a day or two in bear country.
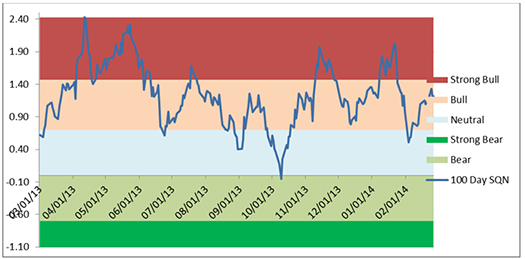
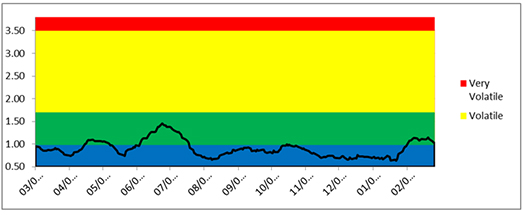
And the last chart is our volatility chart. You can see that most of the last twelve months had quiet volatility. It’s been a long time since we have been in any way “volatile.”
(To see the three previous charts stacked and aligned, click here)
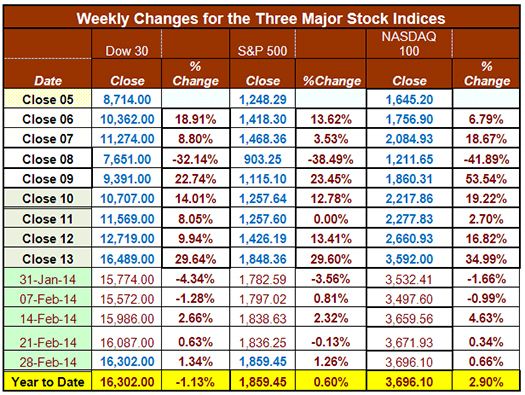
Below is a chart of the weekly changes in the three major US Indices. Two of the indices, despite a poor start in January, are up for the year.
Part III: Our Four Star Inflation-Deflation Model
In the simplest terms, inflation means that stuff gets more expensive, and deflation means that stuff gets cheaper. There’s a correlation between the inflation rate and market levels, so the inflation rate can help traders understand big-picture processes.
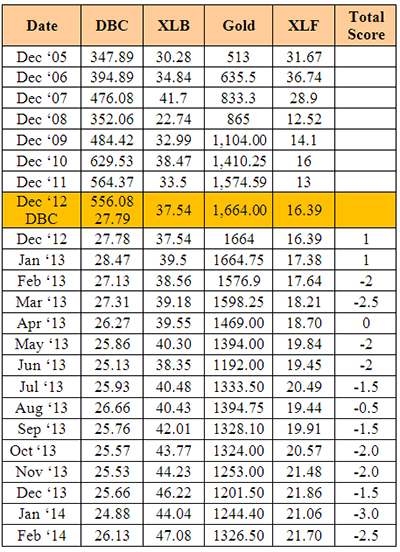
Looking back over the most recent two-month and six-month periods provides the current month’s score, given in the table below.
Month |
DBC2 |
DBC6 |
XLB2 |
XLB6 |
Gold2 |
Gold6 |
XLF2 |
XLF6 |
Total Score |
|
Higher |
Lower |
Higher |
Higher |
Higher |
Lower |
Lower |
Higher |
|
Feb 14 |
|
-1/2 |
|
+1 |
|
-1/2 |
|
-1/2 |
-2.5 |
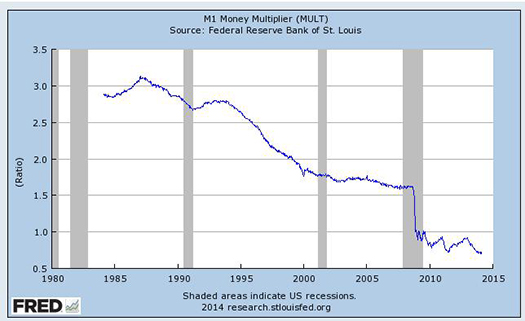
Again, it was another month where the deflationary forces seem to be winning. We have now had ten straight months with negative scores. One reason for this, as we continually point out is that banks are not lending. The money multiplier put out by the Fed is still at 0.7 rather than the normal 3.0 that we tend to see which stimulants are really working. It’s interesting because the Fed has discontinued the old series and now does it on a seasonally adjusted basis. However, the graph still looks the same.
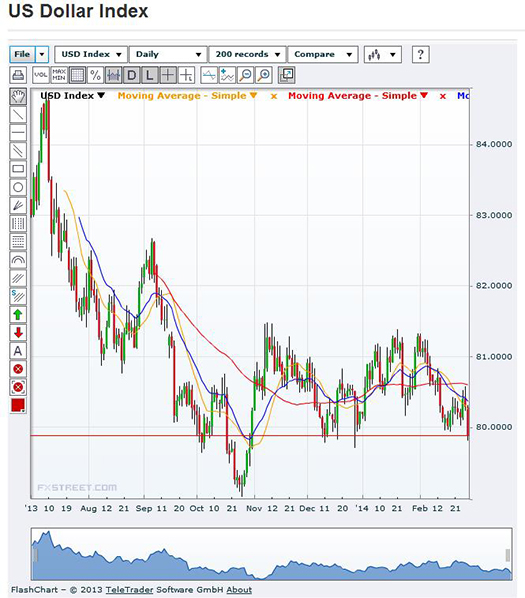
Part IV: Tracking the Dollar
Since its peak in July, the USD has been on a downtrend that recently gathered strength. Since November, the dollar has been in a trading range between $81.5 and $80. However, remember that I will be in Australia for most of the month of March, so my typical joke (and true way too often) is that the dollar will fall against the currency of the country I’m in while I’m there. Right now the Aussie dollar is $0.90. But I’d expect it to be at least $0.95 by mid-March. That’s not a forecast, by the way.
General Comments
Longer term, the competitive stimulus measures from central banks still propel the big picture. Short term, multiple markets continue to offer plenty of opportunities to prepared traders. The keys are awareness, preparation, and execution. There are many, many great opportunities out there for those who are trained and aware enough to find them.
These monthly market updates are not intended for predictive purposes; rather, they’re intended to help traders decide which of their trading systems should work best in the current market conditions. In bear markets—which are almost always volatile by nature—shorter-term strategies, and those that allow going short, tend to work better than long-only or intermediate/longer-term systems.
Which of your trading systems fit this current market type? Of course, this question implies that you have multiple trading systems and that you know how they perform under various market conditions. If you haven't heard of this concept or the other concepts mentioned above, read my book, Super Trader, which covers these areas and more, so that you can make money in any kind of market condition.
Crisis always implies opportunity. Those with good trading skills can make money in this market—a lot of money. There were lots of good opportunities in 2013, and many more to come in 2014. Did you make money? If not, then do you understand why not? The refinement of good trading skills doesn't just happen by opening an account and adding money. You probably spent years learning how to perform your current job at a high skill level. Do you expect to perform at the same high level in your trading without similar preparation? Financial market trading is an arena filled with world-class competition. Additionally, and most importantly, trading requires massive self-work to produce consistent, large profits under multiple market conditions. Prepare yourself to succeed with a deep desire, strong commitment and the right training.
About the Author: Trading coach and author Van K. Tharp, Ph.D. is widely recognized for his best-selling books and outstanding Peak Performance Home Study Program—a highly regarded classic that is suitable for all levels of traders and investors. You can learn more about Van Tharp at www.vantharp.com. His newest book, Trading Beyond The Matrix, is available now at matrix.vantharp.com.
Core Trading Systems — eLearning Beta Testers Needed
 VTI is excited to announce that we will soon have our first trading system course available in an eLearning video format. Ken Long’s Core Trading System workshop offers robust trading systems with four week or longer holding periods. VTI is excited to announce that we will soon have our first trading system course available in an eLearning video format. Ken Long’s Core Trading System workshop offers robust trading systems with four week or longer holding periods.
Ken developed these low-maintenance systems to earn consistent returns over longer periods of time in a limited universe of the most liquid offerings. Ken reviews five specific portfolio strategies in depth, explains their simple rules and reviews their results over short and long term periods. These systems are easy to manage, yet they have consistently outperformed the market.
Our new eLearning version of the workshop contains over 6 hours of recorded video from the live workshop. The eLearning course also includes the documents and spreadsheet tools that Ken hands out at the live workshop. Click here to read a full description of the workshop.
Before we release the product we want a few beta testers to take the course and give us feedback. In exchange for your feedback you can purchase the course at a significant discount off its normal price of $1,295. We will only select a handful of people to participate in this test group.
If you would like to be considered, email van@vantharp.com.
Workshops
Combo Discounts available for all back-to-back workshops!
See our workshop page for details.
Trading Tip
February 2014 SQN® Report
by Van K. Tharp, Ph.D.
There are numerous ETFs that now track everything from countries, commodities, currencies and stock market indices to individual market sectors. ETFs provide a wonderfully easy way to discover what’s happening in the world markets. Consequently, I now apply a version of my System Quality Number® (SQN®) score to measure the relative performance of numerous markets in a world model.
The Market SQN score uses the daily percent change for input over a 100-day period. Typically, a Market SQN score over 1.45 is strongly bullish and a score below -0.7 is very weak. The following color codes help communicate the strengths and weaknesses of the ETFs in this report:
- Green: ETFs with very strong Market SQN scores (0.75 to 1.5).
- Yellow: ETFs with slightly positive Market SQN scores (0 to 0.75).
- Brown: ETFs with slightly negative Market SQN scores (0 to -0.7).
- Red: Very weak ETFs that earn negative Market SQN scores (< -0.7).
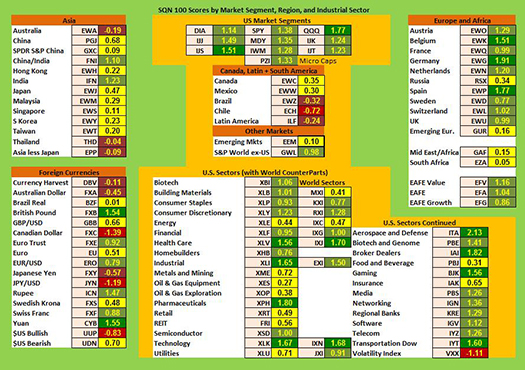
The world market model spreadsheet report below contains most currently available ETFs; including inverse funds, but excluding leveraged funds. In short, it covers the geographic world, the major asset classes, the equity market segments, the industrial sectors and the major currencies.
World Market Summary
Each month, we look at the equities markets by segment, region and sector.
All US sectors are green. Europe is mostly green with two yellows for Russia and Emerging Europe. In Asia, however, we see mostly yellow with two negative areas — Australia and Thailand. There are only two green areas in Asia which both involve India. In the Americas (other than the US) we have Canada and Mexico being neutral with every other country or region being negative.
(To see a larger version of this chart, click here)
Currencies show that both the British Pound and the Yuan are very strong. Other fairly strong currencies include the Euro, the Rupee, and the Swiss Franc. The Aussie dollar, the Canadian Dollar, the Yen, and the US Dollar are all negative.
From a sector standpoint, we again see mostly green and some yellow. The strongest areas are Aerospace, Broker Dealers (the markets are strong), Gaming, Dow Transports, Industrials, Pharmaceuticals, Health Care and Technology, all of which are dark green. Biotech, Building Materials, Consumer Discretionary, Media, Networking, Regional Banks, Software, Telecom and semiconductors all have ratings of 1.0 or higher. Only one sector is negative and that’s volatility suggesting we are safe from a bear market for a while.
Commodities, Real Estate, Debt, Top and Bottom Lists
The next chart shows real estate, debt instruments, commodities and the top and bottom ETFs for the past 100 days.
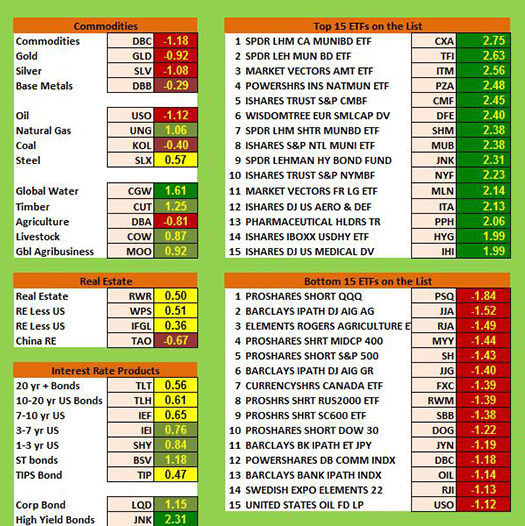
Global water is the only dark green commodity. Natural gas, timber, livestock and global agribusiness are all light green. Metals, are still pretty weak but overall, most commodities are negative, including oil, coal, agriculture and all the metals. US real estate is weak compared with US Stock and Chinese real estate is negative. All the interest rate sectors are positive, with Junk Bonds actually being dark green and above 2.0. Those who need income are going to “trash” to get it.
In the top market SQN scoring ETFs, we have 13 groups with SQN scores of 2.0 or above as opposed to seven for last month. Municipal bonds are still the king and most of the top 10 areas relate to interest rates. None of the weakest ETFs are below -2.0. The weak ones are commodities and short funds.
Summary
Now let’s look at our newest table which measures the percentage of ETFs in each of the strength categories. Strong bull moved from 8% to 18.9% and the bullish sign is now 67.3% which is the highest in 14 months. The bearish side is only 13% which is the second lowest total since I’ve been keeping track of these scores.
Date |
Very Bullish |
Bullish |
Neutral |
Bearish |
Very Bearish |
|
> 1.5 |
0.75 - 1.5 |
0 - 0.75 |
0 - -0.7 |
< - 0.7 |
January 31st |
27.1% |
39.6% |
20.7% |
6.4% |
4.7% |
February 28th |
10.3% |
45.2% |
24.4% |
11.9% |
7.5% |
March 31st |
39.2% |
25.5% |
19.1% |
9.0% |
6.4% |
April 30th |
49.1% |
21.1% |
14.8% |
8.0% |
6.2% |
May 31st |
29,2% |
23.6% |
19.9% |
12.3% |
14.2% |
June 30th |
2.1% |
31.0% |
23.2% |
22.0% |
20.9% |
July 31st |
8.2% |
33.5% |
29.0% |
13.3% |
15.2% |
August 30th |
1% |
15% |
46.4% |
19.3% |
17.5% |
Sept. 30th |
1% |
13.8% |
42.3% |
23.0% |
19.1% |
Nov. 1st |
13.3% |
48.3% |
21.8% |
12.5% |
3.3% |
Dec 1st |
14.6% |
42.7% |
24.2% |
13.3% |
4.3% |
Dec 31st |
19.3.% |
45.5% |
22.0% |
11.3% |
2.9% |
January 31st |
8.0% |
49.3% |
20.7% |
12.7% |
7.6% |
February 28th |
18.9% |
48.4% |
18.1% |
6.2% |
6.8% |
What's Going On?
I guess the market likes Janet Yellen, at least for now. The fundamentals are still terrible but the stock market seems to be one of the key places to be. That’s just below the readings we had in April.
Have a great 2014. I will be out of communication for the early part of next month but one of my research assistants, Frank Eaves will write the update for March. Until April, this is Van Tharp.
The markets always offer opportunities, but to capture those opportunities, you MUST know what you are doing. If you want to trade these markets, you need to approach them as a trader, not a long-term investor. We’d like to help you learn how to trade professionally because trying to navigate the markets without an education is hazardous to your wealth.
All the beliefs given in this update are my own. Though I find them useful, you may not. You can only trade your own beliefs about the markets.
 Ken's Class Ken's Class
In this 16 minute video, Ken goes through several case studies from the week of February 19 of how watching for opportunities in the swing timeframe (patterns over several days) leads to opportunities on an intraday basis.
Click here to watch the video.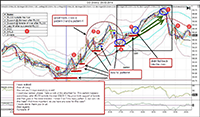
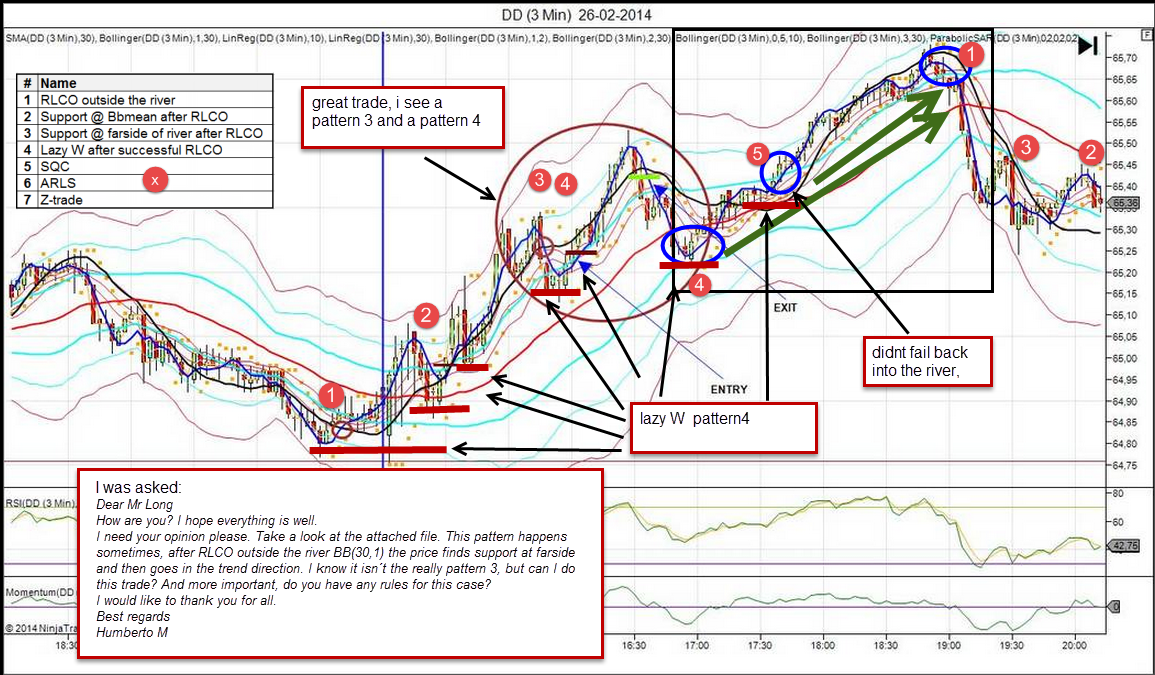
In this 7 minute video, Ken uses a question from a chat room participant to analyze a particular chart and describe how he sees several RLCO patterns. It’s a lesson in the RLCO framework as well as the learning community in action.
Click here to watch the video.
Ken will be back in May with his live Swing Trading Systems Workshop.
Matrix
"I found Trading Beyond the Matrix to be the perfect guide for traders. As I am new to this business it's the best time to get some information regarding myself.
After reading this book, I feel such confidence in my trading and am completely stress free. Now, the days I am trading I am in a happy mood.
I am grateful to Van Tharp for providing this wonderful book." (Edited for clarity)
Thanking you
Arpit S.
Enter the Matrix Contest for a chance to win a free workshop!
We want to hear about the one most profound insight that you got from reading Van's new book, Trading Beyond the Matrix, and how it has impacted your life. If you would like to enter, send an email to van@vantharp.com.
If you haven't purchased Trading Beyond the Matrix yet, click here.
For more information about the contest, click here.
Ask Van...
Everything we do here at the Van Tharp Institute is focused on helping you improve as a trader and investor. Consequently, we love to get your feedback, both positive and negative!
Click here to take our quick, 6-question survey.
Also, send comments or ask Van a question by clicking here.
Back to Top
Contact Us
Email us at suggestions@vantharp.com
The Van Tharp Institute does not support spamming in any way, shape or form. This is a subscription based newsletter.
To change your e-mail Address, e-mail us at info@vantharp.com.
To stop your subscription, click on the "unsubscribe" link at the bottom left-hand corner of this email.
How are we doing? Give us your feedback! Click here to take our quick survey.
800-385-4486 * 919-466-0043 * Fax 919-466-0408
SQN® and the System Quality Number® are registered trademarks of the Van Tharp Institute
Be sure to check us out on Facebook and Twitter!
 
Back to Top |