Tharp's Thoughts Weekly Newsletter (View On-Line)
-
Article System Development Pitfalls and Parameter Permutation by Dave Walton
-
-
Trading Tip 2014 First Half Sector and Asset Performance by D. R. Barton, Jr.
 $700 Discount on Day Trading Systems Workshop Ends TODAY! $700 Discount on Day Trading Systems Workshop Ends TODAY!
Learn two robust day trading systems; the Frog system and the RLCO system. Come experience why our past students love learning from dynamic instructor, Ken Long.
Workshop Dates: July 18-20, Live Trading July 21-22
For more information or to register, click here.
Article
Editor’s Note: In May, Super Trader Dave Walton’s paper about SPP won the prestigious Wagner Award from the National Association of Active Investment Managers. We are honored to have a second Wagner Award winner as a Van Tharp Institute client and Tharp's Thoughts contributor. Congratulations Dave!

System Development Pitfalls and System Parameter Permutation
by Dave Walton
View On-line
Last November I wrote a newsletter article that discussed the topic of Data Mining Bias (DMB) and how it can fool traders into believing overly optimistic back-tested results of a trading system. The last part of that article briefly outlined some solutions to this problem.
Today I want go into some detail on a simple yet powerful method to effectively mitigate DMB and more accurately estimate future trading system performance. I created a method named System Parameter Permutation (SPP) to do just that.
Before I get into the details of SPP, I first want to quickly review the data mining bias and also discuss two other pitfalls that systematic traders face relying on back-test results: using only point estimates and not considering the timeframe associated with system performance estimates.
System Development Pitfall #1 — Data Mining Bias
To recap, Data Mining Bias is the inherent inflation of system performance from selecting the best performing set of parameters in back-tests. DMB is commonly known by other names such as curve-fitting, over-fitting, data snooping, or over-optimization. DMB is characteristic of typical system development processes yet remains largely unknown, misunderstood, or ignored.
Optimizing a trading system means that the system developer has “cherry picked” the best set of rules from the many combinations tested to arrive at some optimum system performance. That hypothetical historical performance, however, comes from two sources: the system’s “edge” and the luck of the specific match between system rules and random market gyrations that occurred in the past. Cherry picked rules can benefit greatly from the “good luck” of a particular data set. Unfortunately the system developer cannot know the relative contribution from the system’s edge from the luck in the data. The good luck in the data (highly likely to be non-repeating) has an inflationary effect on system performance. This system performance inflation is DMB at work but again, so often system developers don’t know about the bias, don’t understand ithe issue, or just ignore it.
System Development Pitfall #2 — Relying on Point Estimates
Another typical pitfall involves basing decisions off of point estimates. This statistical term simply means using a single number as an estimate. Imagine you’ve followed Van’s advice to define your trading objectives and for simplicity’s sake, you want to make a 15% annual return with a max drawdown no larger than 10%. Then you developed a trading system for bull normal market types and developed a position sizing strategy that meets those objectives, at least in a back-test. You may be happy and ready to start trading this system in the next bull normal market. You are still missing, however, a lot of important information.
It would be much more informative and useful to understand the full range of possible results that your system might generate. With a better understanding of the possible performance range, you could then calculate some probabilities of achieving some minimum desired level of performance. If you determine there is a 90% chance of achieving the objectives in a bull normal market type, the decision to start trading can be made with a strong level of confidence. On the other hand, if you find only a 10% probability of the system performing well enough to meet your objectives, you may decide to go back to into system development mode rather than start trading it.
System Development Pitfall #3 — Ignoring Timeframes with Performance Estimates
To make matters more complicated, the odds of achieving a certain level of system performance depend on the length of the measurement time period. Let’s say the example trading system from above was back-tested over the bull normal markets for a 10-year period. The range of probable outcomes for that timeframe is shown by the blue line on the chart below. It is a statistical fact (and an unfortunate one for those who lack statistics knowledge) that drastic deviations from the long-run expected performance can be expected in shorter time periods.
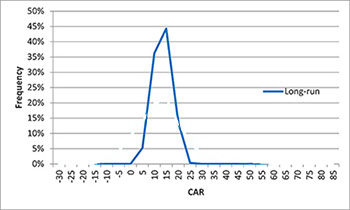
For our example system, let’s say we knew the most likely outcome was a 15% annual return for bull normal market types over a period of 10 years. If you had only the 15% return estimate but trading the system in a bull normal market actually resulted in a 10% loss, good luck trying to figure out what happened. All you know is that the realized performance is far less than the expected performance. With such limited information, you have no way to make a data driven decision about what to do next.
What if, however, you had some estimation about the short term outcomes that could occur? What if you understood that the short-run, realized performance could range from significantly better to significantly worse than the expected 15% return for the long term? Then, you could use this knowledge to make an informed decision about what to do next. The range of probable short term outcomes appears as the red line in the chart below:
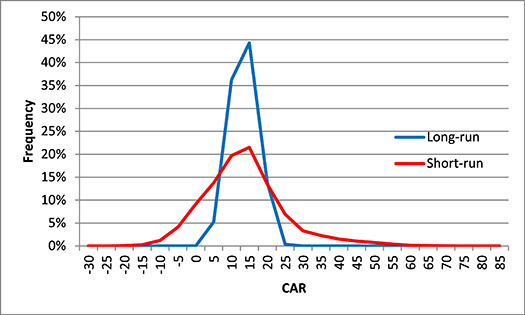
With the additional information in the chart, you can clearly see that a -10% return is within short-run expectations, albeit at a very low probability.
The SPP Solution
So how does a system developer avoid these pitfalls? Several generally accepted techniques that range in effectiveness and complexity can help. My last article in November discussed several methods such as cross validation and data mining bias compensation that combat DMB. To address the point estimate problem, traders often make use of Monte Carlo simulations. Unfortunately, all of these methods make tradeoffs and the more effective techniques tend to be far more complex.
So is there a better way? I thought there had to be and this is exactly why I developed SPP.
SPP is really an evaluation tool. The method provides a practical means of estimating the range of performance expected from a trading system so mechanical traders better understand the likelihood of achieving their specific performance objectives. SPP mitigates the data mining bias effectively but it is also simple. The method uses standard trading system optimization approaches that are already built-into generally available system development software packages.
Beyond the DMB minimization benefits, SPP also helps system developers objectively determine: 1) the performance of the inherent edge expected in the long-run, and 2) the worst-case performance expected in the short-run. Traders can use this information to make data-driven decisions such as—
- whether to initiate trading a newly developed system,
- determine if an actively traded system is “broken”, and
- whether to continue or cease trading an active system.
First, it is important to understand where SPP fits in an overall quantitative system development process. Before getting to the SPP process, many important steps must be completed: determining your beliefs about the big picture, market selection, trading timeframe, strategy selection, market type, and the system's individual components such as setup, entry, 1R stop, and exits. Once that hard work is done, you can then apply SPP to help evaluate how well or if the system meets your performance objectives.
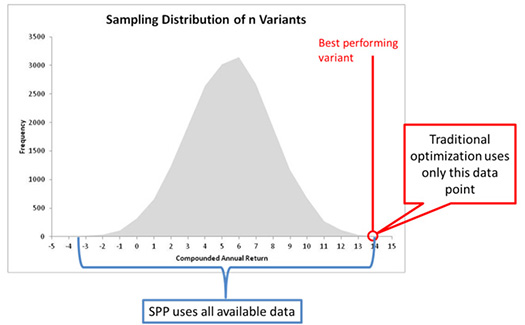
Unlike standard system optimization, SPP does not simply choose the best set of parameters but rather uses all of the performance data available for all sets of parameters evaluated during optimization. Whereas traditional optimization picks the best set of parameters and discards the rest, SPP makes use of all available information. The figure below illustrates the difference.
SPP follows these general steps:
- A range of trading system parameters and an evaluation time period are selected.
- All combinations of the selected parameters are simulated individually (as would be done in exhaustive optimization) using a realistic, portfolio-based back-test engine.
- The results of each simulation are combined to create a range of values for each performance metric of interest.
The figure below graphically illustrates the SPP process.
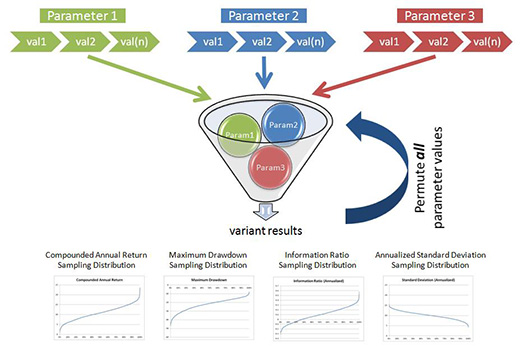
In this case, I chose sampling distributions for four performance metrics. You are free to choose any performance metrics applicable to your specific objectives. Once you have distributions of performance metrics, you can then make probabilistic, data-driven decisions about whether to start trading a system and when to stop.
Conclusion
The majority of traditional system development approaches provide a single point estimate of performance biased by DMB and oblivious to shorter timeframe performance swings. The limited information from such a biased point estimate makes trading decisions difficult at best. In contrast, SPP produces sampling distributions of system metrics that allow more realistic decision making based on probabilities. Ultimately SPP offers a simple, easy to use, yet realistic method to estimate future system performance.
About the Author: Dave Walton has an engineering background and recently completed the first phase of the Super Trader Program. He advocates a scientific approach incorporating validation principles for system development and he applies statistical methods to trading. His Wagner Award winning paper on SPP, an FAQ, and additional information are available at his company’s website: www.statistrade.com.
Workshops
New Two-Day Version of Tharp Think Coming in September |
| July |
| July 12-13 |
Oneness Awakening Weekend
with Janie Guill and Van Tharp
Don't miss a chance to learn more about how you can become more aware, positive, calm, centered, and successful. |
| July 18-20 |
Day Trading Systems
with Ken Long |
| July 21-22 |
Live Day Trading
with Ken Long |
| September: USA |
| Sept 6-7 |
New Version of Tharp Think with Van Tharp
More information to come.
A new, two-day workshop designed to teach you the key levels of transformation that are the mission of the Van Tharp Institute. |
| September: Berlin, Germany |
| Sept 19-21 |
Peak Performance 101
with Van Tharp and co-instructor Janie Guill |
| Sept 23-26 |
Peak Performance 202
with Van Tharp and Libby Adams and co-instructor Janie Guill |
| Sept 28-30 |
Peak Performance 203
with Van Tharp and co-instructor Janie Guill |
| October |
| Oct 11-13 |
Forex Trading
with Gabriel Grammatidis |
| Oct 14-15 |
Live Forex Trading
with Gabriel Grammatidis |
| Oct 17-19 |
Swing Trading Systems
with Ken Long |
Just Added: November |
| Oct 30-Nov 1 |
Peak Performance 101
with Van Tharp and co-instructors RJ Hixson and Janie Guill |
| Nov 3-6 |
Peak Performance 202
with Van Tharp and Libby Adams
and co-instructors RJ Hixson and Janie Guill |
Combo Discounts available for all back-to-back workshops!
See our workshop page for details.
Trading Tip
2014 First Half Sector and Asset Performance Summary
by D. R. Barton, Jr.
The first half of 2014 showed us activity that was strikingly similar to the first four months of 2013: defensive & dividend-rich have dominated performance. In 2013, you’ll recall that sectors like utilities then took a beating for the rest of the year… I suggest you keep your eye on this rotation pattern as a possibility in 2014 as well. We’ll talk about the current trends at the end of this piece.
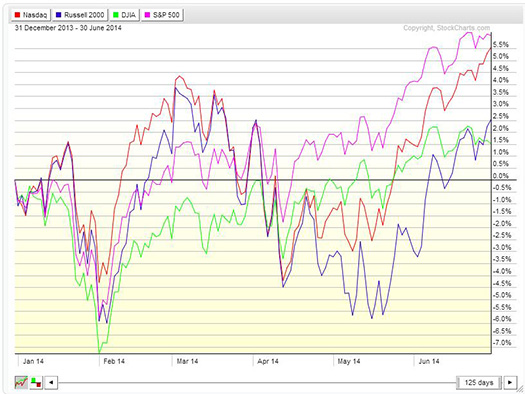
Six Months of Major U.S. Indexes
Here is a StockCharts.com relative performance chart showing the price appreciation for the four major U.S. indexes from the close of 12/31/13 to the close of 6/30/14 (other global indexes are reviewed below). We see that the S&P 500 and NASDAQ have been leading for the year and the Dow 30 is again the laggard. The Russell 2000 has started to make up ground since the May lows:
The Nine S&P Sectors
With the S&P leading the charge, I find it informative to take a look at the major sectors on a relative performance basis: relative to each other (i.e. on the same chart) and relative to the overall S&P 500 so we can see which sectors are leading and lagging the broader index:
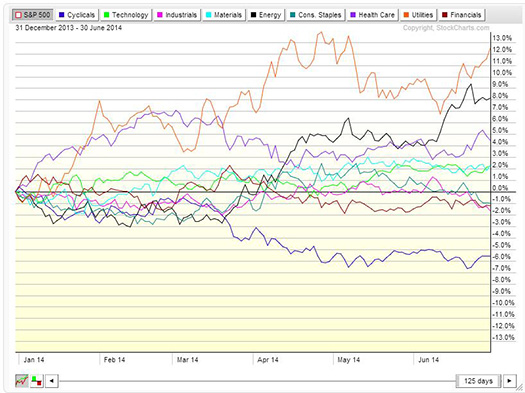
If we were to look back at the first four months of 2014, we would find Health Care, Utilities and Consumer Staples leading the pack by a fairly wide margin. Through the first six months of this year, Utilities and Health Care are still at the top of the heap, with Energy taking the place of Consumer Staples, which lags even the broader S&P 500 this year. Other lagging sectors are Industrials and Financials with Consumer Discretionary (called Cyclicals on chart) lagging by a large amount.
A Broader Look Including Global Indexes and Other Asset Classes
Josh Brown at reformedbroker.com shared the Bank of America Merrill Lynch Research Investment Committee Report that shows the performance of a much broader group of indexes. Note that the index returns here include dividend performance where the stockcharts.com charts above are based purely on price data:
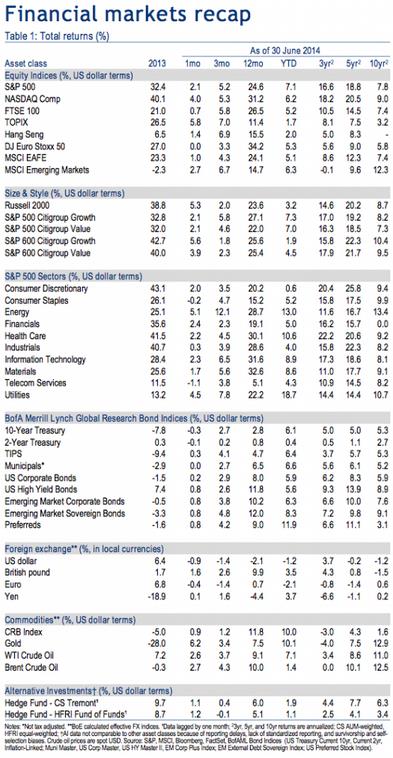
Of note in this list is the strong performance of preferred stock (another win for dividend-rich assets) and the resurgence in gold and commodities in general.
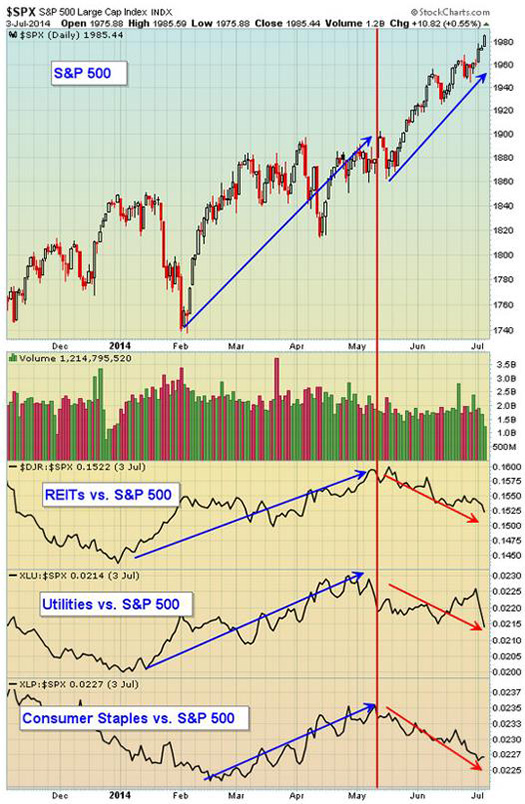
Are We Rotating Back Out of Defensive Sectors?
Despite the strong year-to-date performance of health care, utilities and preferred stocks, in the last seven weeks (including July 2014 month-to-date data) we are seeing an increased risk appetite among investors. From the 61 Capital Weekly Research Briefing, here is a very interesting chart followed by a very interesting table. First, we see underperformance by “risk off” type of investments:
Next is a list of stocks in the Consumer Discretionary arena that have outperformed the XLK ETF itself by more than 50% over the last seven weeks:
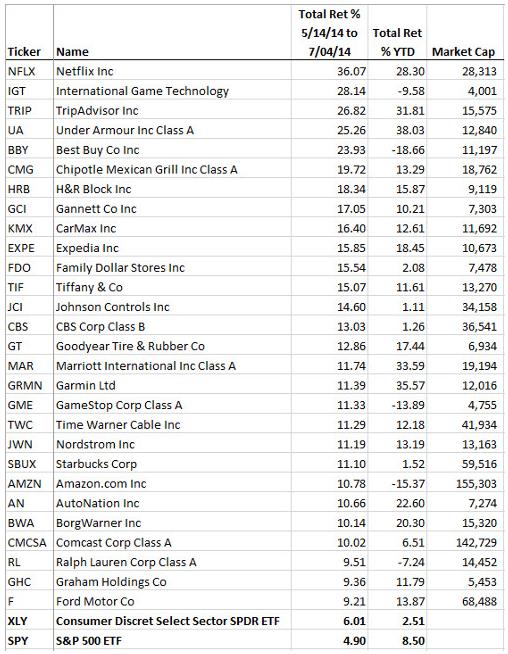
You see some big names on this list that had been very beaten down earlier in the year (NFLX, TRIP, CMG, AMZN, etc.). This could be a sign that investors’ risk appetite has returned, even if reluctantly so.
As always, your thoughts and comments are always welcome - please send them to drbarton “at” vantharp.com
Great Trading,
D. R.
About the Author: A passion for the systematic approach to the markets and lifelong love of teaching and learning have propelled D.R. Barton, Jr. to the top of the investment and trading arena. He is a regularly featured guest on both Report on Business TV, and WTOP News Radio in Washington, D.C., and has been a guest on Bloomberg Radio. His articles have appeared on SmartMoney.com and Financial Advisor magazine. You may contact D.R. at "drbarton" at "vantharp.com".
Disclaimer
New
 One of the primary objectives of longer-term systems is that they require less management than shorter term systems. Ken's Core Systems can be operated outside of market hours in less than an hour per month. One of the primary objectives of longer-term systems is that they require less management than shorter term systems. Ken's Core Systems can be operated outside of market hours in less than an hour per month.
You can now stream the digitally recorded Core Trading Systems Workshop and download the companion documents for a special introductory price. Learn five trading systems from the dynamic Dr. Ken Long in your own space, at your own pace!
At $1,295 it's half the cost of the live workshop. Plus, for a limited time...
...we are releasing it for only $995!
Buy Now
We've complied all you need to know about this new offering. Go to www.vantharp.com/products/core-workshop-video-home-study.asp
For a short video overview about the course, click here.
Matrix Insights
Coming Next Week: Vote on Your Favorite
Matrix Insight Entry
Over the past year, we have received so many amazing letters telling us about the insights many of you had while reading Trading Beyond the Matrix. We have shared those letters each week and now the time has come to choose a winner of the contest! Next week, we will reveal our 5 favorite insights, then you will vote on your favorite out of those 5. The entry with the most votes will win a free workshop at the Van Tharp Institute! Check back next week to vote.
Ask Van...
Everything we do here at the Van Tharp Institute is focused on helping you improve as a trader and investor. Consequently, we love to get your feedback, both positive and negative!
Send comments or ask Van a question by clicking here.
Also, Click here to take our quick, 6-question survey.
Back to Top
Contact Us
Email us at suggestions@vantharp.com
The Van Tharp Institute does not support spamming in any way, shape or form. This is a subscription based newsletter.
To change your e-mail Address, e-mail us at info@vantharp.com.
To stop your subscription, click on the "unsubscribe" link at the bottom left-hand corner of this email.
How are we doing? Give us your feedback! Click here to take our quick survey.
800-385-4486 * 919-466-0043 * Fax 919-466-0408
SQN® and the System Quality Number® are registered trademarks of the Van Tharp Institute
Be sure to check us out on Facebook and Twitter!
 
Back to Top |


