Tharp's Thoughts Weekly Newsletter
-
Article: January 2015 Market Update:
Neutral Normal, Barely
by Van K. Tharp, Ph.D.
-
Workshops: Three Workshops in Sydney Coming Next Month
-
Tip: January 2015 SQN ® Report, By Van Tharp
One Setup, Multiple Trades
In this 16 minute video, Ken Long explains a series of trades he took over the last two days using a number of his market methodologies. First, he gives a thorough review of his overall market health check chart, then provides a swing trade setup, and finally shows how a specific chart pattern offered a low risk opportunity. You can see and hear how these different elements fit together for a profitable day trade on February 2 that then evolved into a swing trade overnight. Then, on February 3, he closed the swing trade while the chart revealed another RLCO intraday trade opportunity in the opposite direction.
Join Ken in 6 weeks for his popular Day Trading Workshop, followed by two days of live trading. Click here to learn more.
To register or to see our full workshop schedule, click here.
Article
January 2015 Market Update:
NEUTRAL NORMAL - BARELY
by Van K. Tharp, Ph.D.
View in browser
I always say that people do not trade the markets; they trade their beliefs about the markets. In that same way, I'd like to point out that these updates reflect my beliefs. If my beliefs and your beliefs are not the same, you may not find them useful. I find the market update information useful for my trading, so I do the work each month and am happy to share that information with my readers.
However, if your beliefs are not similar to mine, then this information may not be useful to you. Thus, if you are inclined to do some sort of intellectual exercise to prove one of my beliefs wrong, simply remember that everyone can usually find lots of evidence to support their beliefs and refute others. Just simply know that I admit that these are my beliefs and that your beliefs might be different.
These monthly updates are in the first issue of Tharp's Thoughts each month. This allows us to get the closing month's data. These updates cover 1) the market type (first mentioned in the April 30, 2008 edition of Tharp's Thoughts), 2) the five week status on each of the major US stock market indices, 3) our four star inflation-deflation model plus John Williams' statistics, and 4) tracking the dollar. I will now report on the strongest and weakest areas of the overall market as a separate SQN™ Report. And that may come out twice a month if there are significant market charges.
Part I: Van Commentary—The Big Picture
The S&P 500 market type direction went from bull to neutral on January 5th and has stayed there ever since. On January 30th the Market SQN score for 100 days was 0.01, the absolute lowest score it can have without entering bearish territory. After 5 new all-time high closes in December, there were none in January. The 100 day range change percentage on January 30 was -0.33%. Thus, it was negative even though the Market SQN score was still calling a neutral market.
We are in a period of a strong US dollar, deflation, a sideways to up market which has now stopped producing new all-time highs. Gold has started to move up. The global market (See the SQN Report) looks dismal.
That’s the big picture in a nutshell.
Debt Clock
The State of the United States |
Month Ending |
National Debt |
Federal Tax Revenue |
Federal Spending |
Trade Deficit |
Debt Per Family |
Unfunded Liabilities |
Taxpayers |
People supported by them |
July 31 2012 |
$15.93 trillion |
$2.364 trillion |
$3.632 trillion |
$810 billion |
$684,405 |
|
|
|
Dec 30 2012 |
$16.42 trillion |
$2.452 trillion |
$3.540 trillion |
$740.7 billion |
$732,086 |
|
|
|
July 31, 2013 |
$16.89
Trillion |
$2.73
trillion |
$3.535 trillion |
$703 billion |
$748,458 |
Unfunded Liabilities |
115.2 million |
109.9
95.4% |
Dec 31, 2013 |
$17.27 trillion |
$2,82 trillion |
$3,480 trillion |
$692 billion |
$751,294 |
$127.2 trillion |
115.0 million |
108.5M
94.3% |
Aug 31, 2014 |
$17.70 trillion |
$2.97 trillion |
$3.53 trillion |
$706 billion |
$757,297 |
$118.0
trillion |
116.5 million |
104.5
90.0% |
Sep 30, 2014 |
$17.77 trillion |
$2.98 trillion |
$3.53 trillion |
$707 billion |
$730,321 |
$116.3
trillion |
116.7 million |
104.9
90.0% |
Oct 31, 2014 |
$17.9 trillion |
$3.05 trillion |
$3.53 trillion |
$703.5 billion |
$729,784 |
$115.4 trillion |
116.9 million |
105.1
89.9% |
Nov 29, 2014 |
$18.0 trillion |
$3.07 trillion |
$3.55 trillion |
$710.8 billion |
$729,477 |
$115.7 trillion |
117.1 million |
105.1
89.7% |
Dec 31, 2014 |
$18.04 trillion |
$3.08 trillion |
$3.57 trillion |
$713.2 billion |
$733,741 |
$92.5 trillion |
117.3 million |
104.4
89.0% |
Jan 31, 2015 |
$18.10 trillion |
$3.11 trillion |
$3.59 trillion |
$344.1 billion |
$732,620 |
$94.1 trillion |
117.5 million |
105.7
90.0% |
The usdebtclock.org listing for unfunded US liabilities has gone down from the May 31st amount when it was $129.4 trillion. It’s now listed at $94.1 trillion. That’s unbelievably clever manipulation. In 7 months, our unfunded liabilities have decreased by about $35 trillion. Hmm, how is that done? Right now our total unfunded liabilities are $94.1 trillion with most of that being Medicare at $27.4 trillion. The other large portion of the unfunded liabilities figure was for prescription drugs but that amount is no longer listed. The social security unfunded liability is only a little less than our total debt at $13.66 trillion (that’s down from $15+ trillion).
Today, our official debt is $18.1 trillion, up from $16.89 trillion in July 2013. Someone the government is not making that number go away. Furthermore, the debt situation is so bad that the Federal Reserve has had to drive short term interest rates to almost zero and kept long term rates to very low numbers. This will have a long term fatal impact on the U.S. dollar and interest rates have nowhere to go but up. In fact, betting on eventual higher interest rates is about as close to a certain bet (long term) as you could ever make.
The US population is at 320 million with taxpayers standing at 117.5 million. The Boomer retirement wave has begun and retirees now stand at 48.2 million. I’m in that category but I won’t draw any retirement until I am required to by law. Disabled people collecting social security stand at 11.0 million, while food stamp recipients total 46.5 million. That’s 105.7 million people that are supported by the government (or the 117.5 million taxpayers).
In reality, about 11.7 million taxpayers pay 90% of U.S. taxes. This means that 11.7 million workers are supporting 106 million other people through the government. In addition, the top 1% of American tax payers pay 40% of the tax bill. Do these numbers add up to you? Do they seem sustainable? Meanwhile, the official number of unemployed is 8.55 million while the actual number of unemployed is 17.26 million. And these numbers are conservative compared with those published by Shadowstats.com which show unemployment levels at near depression level statistics.
Part II: The Current Stock Market Type Is Neutral Normal (but on the verge of Bear Volatile).
The charts below include a weekly chart of the S&P 500 over the last year, the Market SQN® score for 100 days, and the percent volatility. I typically show the Market SQN for 100 days but I also measure the scores for periods of 200, 100, 50, and 25 days. The 200 day score is bull, the 100 day score is neutral (but on the verge of bear), the SQN 50 is bear, and the SQN 25 is strong bear. Do you see a short term trend here?
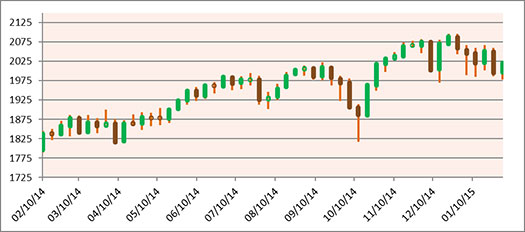
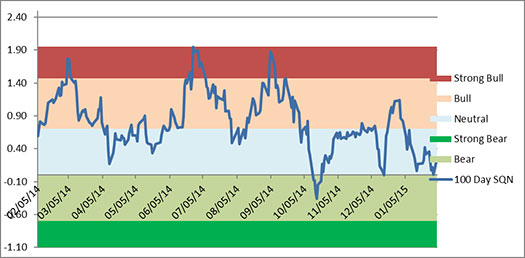
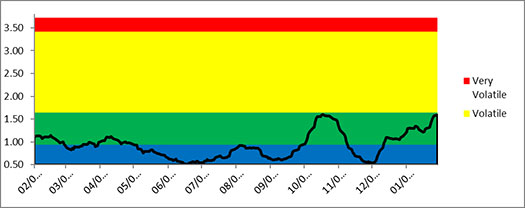
Also look at the volatility, while it is in the normal range still – it is very close to a volatile rating.
Bottom line, we are getting very close to a Bear Volatile market type.
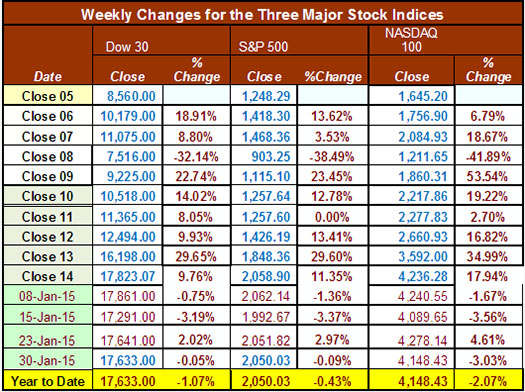
Below is a chart of the weekly changes in the three major US Indices except that I am just showing the end of year closes. All three indices are down for 2015. We have not had a promising start of 2015.
Part III: Our Four Star Inflation-Deflation Model
In the simplest terms, inflation means that stuff gets more expensive, and deflation means that stuff gets cheaper. There’s a correlation between the inflation rate and market levels, so the inflation rate can help traders understand big-picture processes.
Date |
CCI> DBC |
XLB |
Gold |
XLF |
Total Score |
Dec ‘05 |
347.89 |
30.28 |
513 |
31.67 |
|
Dec ‘06 |
394.89 |
34.84 |
635.5 |
36.74 |
|
Dec ‘07 |
476.08 |
41.7 |
833.3 |
28.9 |
|
Dec ‘08 |
352.06 |
22.74 |
865 |
12.52 |
|
Dec ‘09 |
484.42 |
32.99 |
1,104.00 |
14.1 |
|
Dec ‘10 |
629.53 |
38.47 |
1,410.25 |
16 |
|
Dec ‘11 |
564.37 |
33.5 |
1,574.59 |
13 |
|
Dec ’12 CCI>DBC |
556.08
27.79 |
37.54 |
1,564.80 |
16.39 |
1 |
Dec ‘13 |
25.66 |
46.22 |
1674.00 |
21.86 |
1 |
Jan ‘14 |
24.88 |
44.04 |
1244.40 |
21.06 |
-1.5 |
Feb ‘14 |
26.13 |
47.08 |
1326.50 |
21.70 |
-3.0 |
Mar ‘14 |
26.12 |
47.28 |
1291.75 |
22.34 |
+0.5 |
Apr ‘14 |
26.41 |
47.67 |
1288.50 |
21.96 |
+0.0 |
May ‘14 |
26.03 |
49.08 |
1250.50 |
22.29 |
+0.0 |
June ‘14 |
26.58 |
49.64 |
1315.00 |
22.74 |
+2.0 |
Jul ‘14 |
25.32 |
48.65 |
1285.25 |
22.41 |
+1.0 |
Aug ‘14 |
25.03 |
50.53 |
1285.75 |
23.36 |
-2.0 |
Sep ‘14 |
23.22 |
49.59 |
1209.10 |
23.17 |
-2.0 |
Oct ‘14 |
22.31 |
48.40 |
1164.25 |
23.84 |
-2.5 |
Nov’ 14 |
20.42 |
49.16 |
1182.75 |
24.40 |
-2.5 |
Dec ‘14 |
18.45 |
48.59 |
1199.25 |
24.73 |
-3.0 |
Jan ‘15 |
17.40 |
47.69 |
1260.25 |
23.01 |
-3.0 |
This data is up to date through January 2015. In the past 13 months, we have only had three that showed inflationary signs (i.e., last column > 0.0). Every other month in that period has been flat or deflationary with a strong deflationary trend in the last six months.
Month |
DBC2 |
DBC6 |
XLB2 |
XLB6 |
Gold2 |
Gold6 |
XLF2 |
XLF6 |
Total Score |
|
Lower |
Lower |
Lower |
Lower |
Higher |
Lower |
Lower |
Higher |
|
Jan 15 |
|
-1 |
|
-1 |
|
-1/2 |
|
-1/2 |
-3.0 |
Part IV: Tracking the Dollar
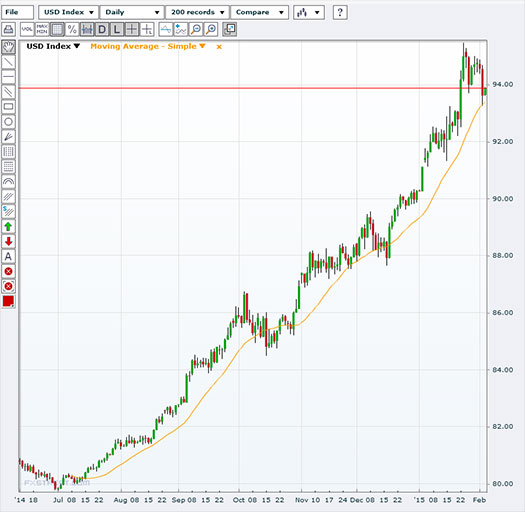
The U.S. Dollar continues its up-move. In fact the chart below over the last 200 days is quite spectacular. It had a slight correction in October but by the end of the month had reached new highs again. A lot of money has been made in the US dollar over the last six month. If this continues, the dollar might be worth more than the Euro fairly quickly.
General Comments
The chart below shows that the S&P 500 has had 48 all-time high closes during 2014. That means about one day each week on average over the last year represented a new all-time high close for the S&P 500. That would seem like a spectacular year.
Month |
S&P 500
High Closes |
Month |
S&P 500
High Closes |
Jan 15 |
0 |
|
|
Dec 14 |
6 |
May 14 |
6 |
Nov 14 |
12 |
Apr 14 |
2 |
Oct 14 |
1 |
Mar 14 |
3 |
Sep 14 |
2 |
Feb 14 |
2 |
Aug 14 |
5 |
Jan 14 |
1 |
Jul 14 |
5 |
|
|
Jun 14 |
8 |
Total |
48 |
Generally, however, 2014 was a sideways and a bullish year. The S&P 500 was up only 11.35% which illustrates why this year was both up and sideways. It was only up 11.35% while it had 48 all-time high closes. And now starting 2015, we just had the first month in a long time with no new all-time high closes in the S&P 500.
This is my prescription for growth in the US economy. Politicians please read.
1) Kill deficit spending immediately, by stopping wars and spending on what we mistakenly call “defense.” We can’t afford to be the world peace keeper any more. We spend more than a trillion per year on “defense.”
2) Make sure no more deficit spending continues by passing a law calling for a re-election of new politicians any year the government cannot spend within their means. (I heard this first from Warren Buffet and borrowed it).
3) Right now the U.S. education system cannot compete with those of many other countries outside of the US except at the university level. And our best universities are filled with brilliant foreign students. Great, let’s accept the situation as it is and allow the brilliant foreign students who getting masters and Ph.D. degrees to immediately become U.S. citizens instead of forcing them to return to their own countries to use the skills we taught them abroad.
4) Give a $50,000 tax rebate to any US citizen getting a Ph.D. in the United States to help them pay for their education or their education loans.
5) Allow US companies to compete in the world in a big way by eliminating the tax on the foreign earnings of US citizen living abroad. Taxing foreign earnings of US citizens living in the US is fine, but not those who must live abroad to help our corporations grow and who must also pay foreign tax on their earnings. In addition, the new tax laws requiring foreign banks to report on the assets of US citizens is totally killing our ability to compete overseas. A US company abroad is now required to have almost 100% foreign employees because US employees cannot get bank accounts that are necessary to live.
6) Reduce Corporate Income tax from some of the highest levels in the world to competitive levels. Do this partially by not taxing foreign earnings from US corporation s that are used to stimulate the economy. This would eliminate the US trade deficit fairly quickly. Right now the US government is saying that companies like Apple that channel their profits into Ireland (9% corporate tax vs 39% in the US) have to be stopped from avoiding US taxes. A much better prescription would be to tax them 10% on money brought back to the US.
7) I now own a Tesla model S, P85D. It has 691 hp. and still gets over 250 miles from a full battery charge. I charge the car in my garage for about 4 hours once each week. That charge comes from nuclear power. And in May I plan to drive the car around the US using Tesla’s free supercharging stations. And it won’t cost me anything to do that. Right now the government gives people a $7500 credit for something that could totally eliminate the US dependency on foreign oil and dramatically reduce air pollution. Tesla has actually released their patents to the rest of the world. The model S actually met two of the criteria that I wanted in a car (great power -- 0-60 in 3.1 seconds) and great gas mileage (infinite). Let’s encourage the US to help Tesla (an American company) with their mission. Obviously, this recommendation is more of a personal bias.
Until next month’s update, this is Van Tharp.
About the Author: Trading coach and author Van K. Tharp, Ph.D. is widely recognized for his best-selling books and outstanding Peak Performance Home Study Program—a highly regarded classic that is suitable for all levels of traders and investors. You can learn more about Van Tharp at www.vantharp.com. His new book, Trading Beyond The Matrix, is available now at matrix.vantharp.com.
Workshops
Combo Discounts available for all back-to-back workshops!
See our workshop page for details.
Trading Tip
January 2015 SQN® Report
by Van K. Tharp, Ph.D.
Click to view in browser for correct formatting
There are numerous ETFs that track everything from countries, commodities, currencies and stock market indices to individual market sectors. ETFs provide a wonderfully easy way to discover what’s happening in the world markets. Consequently, I now apply a version of my System Quality Number® (SQN®) score to measure the relative performance of numerous markets in a world model.
The Market SQN score uses the daily percent change for input over a 100-day period. Typically, a Market SQN score over 1.47 is strongly bullish and a score below -0.7 is very weak. The following color codes help communicate the strengths and weaknesses of the ETFs in this report:
| • |
|
Dark Green: ETFs with very strong SQN® 100 scores > 1.47 |
| • |
|
Light Green: ETFs with strong SQN 100 scores (0.70 to 1.47). |
| • |
|
Yellow: ETFs with slightly positive Market SQN scores (0 to 0.70). These are Neutral/Sideways |
| • |
|
Brown: ETFs with slightly negative Market SQN scores (0 to -0.7). |
| • |
|
Red: Very weak ETFs that earn negative Market SQN scores (< -0.7). |
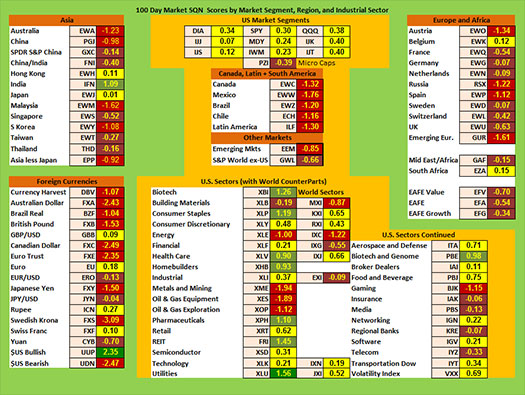
This is basically the same ratings that we use for the Market SQN® Score. The world market model spreadsheet report below contains most currently available ETFs; including inverse funds, but excluding leveraged funds. In short, it covers the geographic world, the major asset classes, the equity market segments, the industrial sectors and the major currencies.
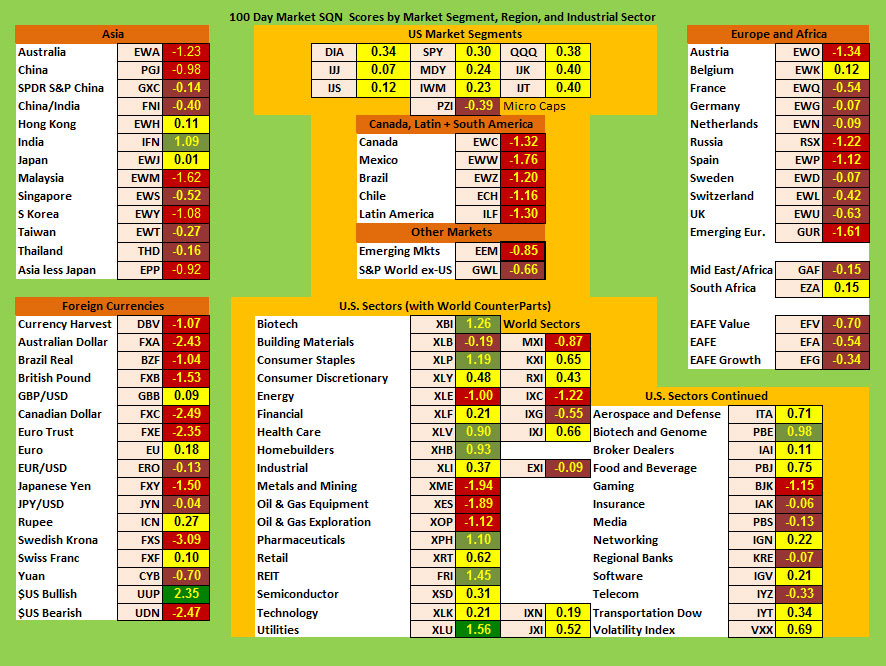
World Market Summary – Equities & Currencies
Each month, we look at the equities markets across the globe by segment, region and sector. Last month, I said I saw one of the worst global pictures I had seen - but this month is worse. India is light green, the US is all yellow, there are a few others areas that are yellow, but the rest of the world is negative. The rest of the equity markets look VERY DISMAL indeed.
So let’s start with Asia. Except for India, Hong Kong, and Japan, basically everything is negative (being either red or brown). The red markets include Australia, China, Malaysia, and South Korea. In addition, all of the Americas except the US are red. Wow.
In Europe and Africa, two countries are yellow (Belgium and S. Africa – but just barely) while the rest are negative. Red areas include Austria, Russia, Spain, and Emerging Europe. Again, wow is all I can say.
Within the US market, only one sector remains dark green and that is utilities. Several sectors are light green including Biotech, Consumer Staples, Health Care, Homebuilders, Pharmaceuticals, REITs, and Biotech and Genome.
There are a number of red areas in the US now which include Metals and Mining, Oil and Gas Exploration, Oil and Gas Equipment, and Gaming. Volatility of the US market (VXX) is now yellow giving a clear warning sign of possible danger ahead.
Currencies are still dominated by the US dollar which is dark green – and it is the only green currency at all. A number of currencies are yellow including the Euro, the Indian Rupee, and the Swiss Franc. All of them, however, are only just yellow. The Australian dollar, the Brazilian Real, the British Pound, the Canadian Dollar, the Japanese Yen, and the Swedish Krona (which has a negative 3 Market SQN score). I suspect the Russian Ruble would be just as bad, but we don’t track it.
(Click here to see a larger version of this chart.)
Commodities, Real Estate, Debt, Top and Bottom Lists
The next chart shows real estate, debt instruments, commodities and the top and bottom ETFs for the past 100 days.
This month in commodities, everything is negative except for gold, timber, and global agribusiness. Many commodities are very negative and blended commodities (DBC) has a Market SQN score of negative 3. Again, the world is not doing that well economically.
US real estate is strong while Chinese real estate is slightly negative.
Finally in the debt instruments, long term bonds (despite the low interest rates) are green. These include everything down to 3-7 year bonds. Short term bonds and 1-3 year notes are light green, while inflation protected bonds are just yellow. Corporate bonds are strong and junk bonds are weak.
Of the top ranking ETFs, we give a list of 15. Of all the ETFs we track, 35 of them are now dark green (which is up from 18 last month). PGF is the strongest with a rarely seen Market SQN® score above 3.0. Most of the green ETFs are bonds or muni-funds or related to the US dollar. 13 ETFs have an SQN above 2.0 this month.
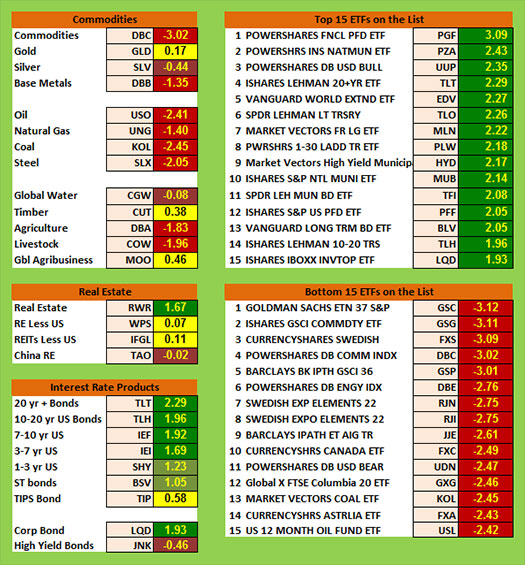
When I look at all the ETFs, 27.3% of the ETFs we track are red. Furthermore, we have 5 ETFs with scores below minus 3.0 but that’s way down from last month’s record of 13 with scores below minus 3.
Summary
In the Market Update above, you probably read that the overall US equity market was neutral in January with the S&P 500 up 1.63% over the last 100 days. The SQN® Report tells us what is really going on more broadly and the picture is dismal.
BE VERY CAREFUL IN THIS MARKET.
Now let’s look at our newest table which measures the percentage of ETFs in each of the strength categories.
Date |
Very Bullish |
Bullish |
Neutral |
Bearish |
Very Bearish |
2013 |
> 1.5 |
0.75 - 1.5 |
0 - 0.75 |
0 - -0.7 |
< - 0.7 |
Jan 31st, |
27.1% |
39.6% |
20.7% |
6.4% |
4.7% |
Feb 28th |
10.3% |
45.2% |
24.4% |
11.9% |
7.5% |
Mar 31st |
39.2% |
25.5% |
19.1% |
9.0% |
6.4% |
Apr 30th |
49.1% |
21.1% |
14.8% |
8.0% |
6.2% |
May 31st |
29,2% |
23.6% |
19.9% |
12.3% |
14.2% |
Jun 30th |
2.1% |
31.0% |
23.2% |
22.0% |
20.9% |
Jul 31st |
8.2% |
33.5% |
29.0% |
13.3% |
15.2% |
Aug 30th |
1% |
15% |
46.4% |
19.3% |
17.5% |
Sep 30th |
1% |
13.8% |
42.3% |
23.0% |
19.1% |
Nov 1st |
13.3% |
48.3% |
21.8% |
12.5% |
3.3% |
Dec 1st |
14.6% |
42.7% |
24.2% |
13.3% |
4.3% |
Dec 31st |
19.3.% |
45.5% |
22.0% |
11.3% |
2.9% |
2014 |
|
|
|
|
|
Jan 31st |
8.0% |
49.3% |
20.7% |
12.7% |
7.6% |
Feb 28th |
18.9% |
48.4% |
18.1% |
6.2% |
6.8% |
Mar 31st |
4.9% |
40.2% |
38.8% |
13.3% |
3.1% |
Apr 30th |
11.1% |
33.9% |
40.2% |
11.3% |
1.8% |
May 31st |
12.5% |
46.5% |
27.7% |
7.6% |
6.0% |
Jun 30th |
53.4% |
33.7% |
14.2% |
2.5% |
0.8% |
Aug 29th |
20.3% |
45.2% |
22.8% |
10.5% |
5.3% |
Sep 30th |
6.6% |
26.9% |
30.2% |
24.0% |
18.5% |
Oct 31st |
2.9% |
17.9% |
38.8% |
17.7% |
26.3% |
Nov 30th |
3.1% |
25.7% |
25.1% |
22.8% |
27.9% |
Dec 31st |
3.7% |
29.2% |
24.8% |
15.6% |
31.2% |
Jan 31st |
7.2% |
9.4% |
35.1% |
25.5% |
27.3% |
By the end October 44% of the ETFs had become bearish, at the end of November it was 50.7%, and this month it’s 52.8%. The number of very bearish scoring ETFs, however, decreased from 31.2% to 27.3%.
I also keep track of the Market SQN scores (100 days) for all of the stocks in the S&P 500. As of January 3rd, the following was true - 78.44% of the S&P 500 stocks had positive Market SQN scores, with 6.2% having scores over 2.0.
21.55% of the S&P 500 stocks had negative Market SQN scores with 0.57% having scores below minus 2.0.
Month |
Above 2.0 |
Positive |
Below minus 2.0 |
Negative |
End Dec 2014 |
6.2% |
78.4% |
0.57% |
21.55% |
End Jan 2015 |
4.0% |
64.3% |
0.38% |
35.73% |
Economic fundamentals are still terrible for the US and the rest of the world. The US stock market and the US dollar are the long top performers in the world. Be careful to base your actions upon what is happening, not what you think might happen.
Until the end of January, this is Van Tharp.
The markets always offer opportunities, but to capture those opportunities, you MUST know what you are doing. If you want to trade these markets, you need to approach them as a trader, not a long-term investor. We’d like to help you learn how to trade professionally because trying to navigate the markets without an education is hazardous to your wealth.
All the beliefs given in this update are my own. Though I find them useful, you may not. You can only trade your own beliefs about the markets.
 Enter the Matrix Contest Enter the Matrix Contest
for a chance to win a free workshop!
We want to hear about the one most profound insight that you got from reading Van's new book, Trading Beyond the Matrix, and how it has impacted your life. If you would like to enter, send an email to van@vantharp.com.
If you haven't purchased Trading Beyond the Matrix yet, click here.
For more information about the contest, click here.
Ask Van...
Everything we do here at the Van Tharp Institute is focused on helping you improve as a trader and investor. Consequently, we love to get your feedback, both positive and negative!
Send comments or ask Van a question by clicking here.
Also, Click here to take our quick, 6-question survey.
Back to Top
Contact Us
Email us at van@vantharp.com
The Van Tharp Institute does not support spamming in any way, shape or form. This is a subscription based newsletter.
To change your e-mail Address, e-mail us at info@vantharp.com.
To stop your subscription, click on the "unsubscribe" link at the bottom left-hand corner of this email.
How are we doing? Give us your feedback! Click here to take our quick survey.
Call us at: 800-385-4486 * 919-466-0043 * Fax 919-466-0408
SQN® and the System Quality Number® are registered trademarks of the Van Tharp Institute and the International Institute of Trading Mastery, Inc.
Be sure to check us out on Facebook and Twitter!
 
Back to Top |


