Tharp's Thoughts Weekly Newsletter
-
Article: June 2015 Market Update:
Neutral Quiet Market Type by Van K. Tharp, Ph.D.
-
-
Tip: June 2015 SQN ® Report by Van K. Tharp, Ph.D.
-
NEW! Swing Trading Systems E-Learning Course
 We are excited to announce that our new Swing Trading Systems home study course is now available! Learn with Dr. Ken Long as he teaches his Swing Trading Systems Workshop via streaming video! We are excited to announce that our new Swing Trading Systems home study course is now available! Learn with Dr. Ken Long as he teaches his Swing Trading Systems Workshop via streaming video!
This new e-learning course includes Ken Long's Swing Trading Workshop, 5 swing trading systems and a bonus workshop featuring Van Tharp on Tharp Think principles. The course also includes extensive downloadable files to support your learning.
You can complete this course at your own pace, from the comfort of your own home or office, and access the materials as many times as you wish during your 1 year subscription period.
Take a look at this video from Ken to learn more about this course.

We have extensive information about the Swing Trading System e-learning course, including how to purchase...click the link below!
Learn More....
Feature Article

June 2015 Market Update:
Neutral Quiet Market Type
by Van K. Tharp, Ph.D.
View on-line to resolve formatting problems
I always say that people do not trade the markets; they trade their beliefs about the markets. In that same way, I'd like to point out that these updates reflect my beliefs. I find the market update information useful for my trading, so I do the work each month and am happy to share that information with my readers.
However, if your beliefs are not similar to mine, then this information may not be useful to you. Thus, if you are inclined to do some sort of intellectual exercise to prove one of my beliefs wrong, simply remember that everyone can usually find lots of evidence to support their beliefs and refute others. Just simply know that I admit that these are my beliefs and that your beliefs might be different.
These monthly updates are in the first issue of Tharp's Thoughts each month. This allows us to get the closing month's data. These updates cover 1) the market type (first mentioned in the April 30, 2008 edition of Tharp's Thoughts), 2) the five week status on each of the major US stock market indices, 3) our four star inflation-deflation model plus John Williams' statistics, and 4) tracking the dollar. I will now report on the strongest and weakest areas of the overall market as a separate SQN™ Report, that may be released as often as twice a month if there are significant market charges.
Part I: The Big Picture
US equities have spent the last 100 days going up 1.5%. Contrast that with the 10 new all-time highs S&P 500 made in the last 100 days (and in 2015). In June, however, the S&P 500 made no new high closes. This is a very deceptive market.
Debt Clock
The State of the United States |
Month Ending |
National Debt |
Federal Tax Revenue |
Federal Spending |
Trade Deficit |
Debt Per Family |
Unfunded Liabilities |
Taxpayers |
People supported by them |
July 31 2012 |
$15.93 trillion |
$2.364 trillion |
$3.632 trillion |
$810 billion |
$684,405 |
|
|
|
Dec 30 2012 |
$16.42 trillion |
$2.452 trillion |
$3.540 trillion |
$740.7 billion |
$732,086 |
|
|
|
July 31, 2013 |
$16.89
Trillion |
$2.73
trillion |
$3.535 trillion |
$703 billion |
$748,458 |
Unfunded Liabilities |
115.2 million |
109.9M
95.4% |
Dec 31, 2013 |
$17.27 trillion |
$2,82 trillion |
$3,480 trillion |
$692 billion |
$751,294 |
$127.2 trillion |
115.0 million |
108.5M
94.3% |
Aug 31, 2014 |
$17.70 trillion |
$2.97 trillion |
$3.53 trillion |
$706 billion |
$757,297 |
$118.0
trillion |
116.5 million |
104.5M
90.0% |
Sep 30, 2014 |
$17.77 trillion |
$2.98 trillion |
$3.53 trillion |
$707 billion |
$730,321 |
$116.3
trillion |
116.7 million |
104.9M
90.0% |
Oct 31, 2014 |
$17.9 trillion |
$3.05 trillion |
$3.53 trillion |
$703.5 billion |
$729,784 |
$115.4 trillion |
116.9 million |
105.1M
89.9% |
Nov 29, 2014 |
$18.0 trillion |
$3.07 trillion |
$3.55 trillion |
$710.8 billion |
$729,477 |
$115.7 trillion |
117.1 million |
105.1M
89.7% |
Dec 31, 2014 |
$18.04 trillion |
$3.08 trillion |
$3.57 trillion |
$713.2 billion |
$733,741 |
$92.5 trillion |
117.3 million |
104.4M
89.0% |
Jan 31, 2015 |
$18.10 trillion |
$3.11 trillion |
$3.59 trillion |
$318.7 billion |
$732,620 |
$94.1 trillion |
117.5 million |
105.7M
90.0% |
Feb 28, 2015 |
$18.14 trillion |
$3.13 trillion |
$3.60 trillion |
$725.0 billion |
$732,054 |
$95.3 trillion |
117.7 million |
|
Mar 31, 2015 |
$18.17 trillion |
$3.15 trillion |
$3.63 trillion |
$723.3 billion |
$757,614 |
$95.7 trillion |
117.8 million |
105.4M
89.5% |
April 30, 2015 |
$18.21 trillion |
$3.11 trillion |
$3.61 trillion |
$720.3 billion |
$759,875 |
$96.0 trillion |
118.1 million |
105.3M
89.1% |
May 29, 2015 |
$18.25 trillion |
$3.12 trillion |
$3.62 trillion |
$720.3 billion |
$761,889 |
$96.5 trillion |
118.3 million |
107.1M
90.5% |
Jun 30, 2015 |
$18.29 trillion |
$3.14 trillion |
$3.63 trillion |
$728.4 billion |
$752,894 |
$97.0 trillion |
118.5 million |
105.1M
88.7% |
So in three months, our official debt has gone up by $120 billion. Furthermore, the tendency for the government to manipulate our unfunded debt amount seems to have tapered off and now it seems to edge up slightly each month.
Incidentally, the debt clock says there are 118.5 million taxpayers. It also says there are 159.7 million people receiving support. However, I’m not sure how they determine that (as some of the sections there are certainly duplicated). As a result, I take US Retirees (48.7 million), food stamp recipients (45.5 million), and disabled people drawing social security (10.9 million). I don’t think there is any overlap here. They total 107.1 million and that’s why I say that they consist of 88.7% of the taxpayers. But remember about 10% of the taxpayers (11.8 million) pay most of the tax revenue. I could also include all government employees (23.7 million) as among those supported by taxpayers (but they do pay taxes).
Part II: The Current Stock Market Type Is Neutral Quiet.
My market type classification is not predictive but rather descriptive — rather than telling us what’s going to happen, it simply tells us what’s going on now. What’s going on now is a neutral quiet market.
I look at the Market SQN score for the 100 day period for the S&P 500 as my major indicator of market type. But we also look at the Market SQN® score for 25, 50 and 200 days. Right now both the 100-day and the 200-day market types are neutral while the SQN score for the 50 and 25 day scores have turned bearish. Volatility is still quiet so don’t expect a roaring bear market anytime soon unless it goes up dramatically. But we could easily shift into a quiet bear by next month.
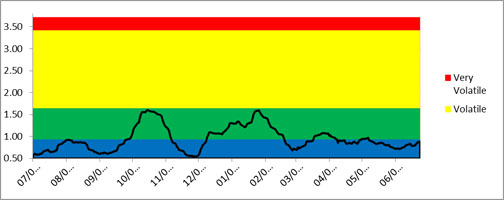
The graphs below include a chart of weekly bars for the S&P 500 over the last year, the Market SQN® score for 100 days, and the ATR percent volatility.
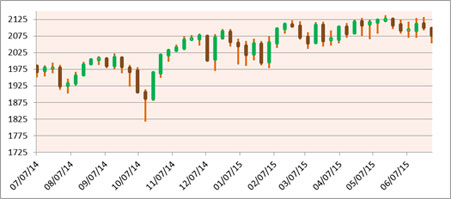
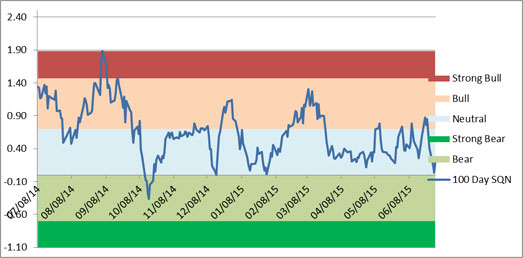
Above, you can see that the market has vacillated between neutral and bull for most of the last twelve months and most of that has been in neutral territory. As you can see from the chart below, the volatility has been normal to quiet most of the year too — never making it to volatile. If you don’t understand market types and don’t have trading systems for this kind of market, neutral quiet is one of the most difficult market types in which to make money.
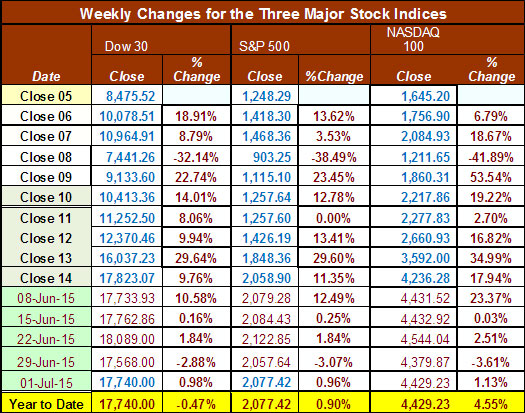
Below is a chart of the weekly changes in the three major US Indices. The Dow is down slightly for the year, the S&P 500 is up barely and the NASDAQ is leading the pack.
Part III: Our Four Star Inflation-Deflation Model
In the simplest terms, inflation means that stuff gets more expensive, and deflation means that stuff gets cheaper. There’s a correlation between the inflation rate and market levels, so understanding inflation and deflation can help traders understand some important big-picture processes.
See the tracking table below.
Date |
CCI> DBC |
XLB |
Gold |
XLF |
Total Score |
Dec ‘05 |
347.89 |
30.28 |
513 |
31.67 |
|
Dec ‘06 |
394.89 |
34.84 |
635.5 |
36.74 |
|
Dec ‘07 |
476.08 |
41.7 |
833.3 |
28.9 |
|
Dec ‘08 |
352.06 |
22.74 |
865 |
12.52 |
|
Dec ‘09 |
484.42 |
32.99 |
1,104.00 |
14.1 |
|
Dec ‘10 |
629.53 |
38.47 |
1,410.25 |
16 |
|
Dec ‘11 |
564.37 |
33.5 |
1,574.59 |
13 |
|
Dec ’12 CCI>DBC |
556.08
27.79 |
37.54 |
1,564.80 |
16.39 |
1 |
May ‘14 |
26.03 |
49.08 |
1250.50 |
22.29 |
+0.0 |
June ‘14 |
26.58 |
49.64 |
1315.00 |
22.74 |
+2.0 |
Jul ‘14 |
25.32 |
48.65 |
1285.25 |
22.41 |
+1.0 |
Aug ‘14 |
25.03 |
50.53 |
1285.75 |
23.36 |
-2.0 |
Sep ‘14 |
23.22 |
49.59 |
1209.10 |
23.17 |
-2.0 |
Oct ‘14 |
22.31 |
48.40 |
1164.25 |
23.84 |
-2.5 |
Nov’ 14 |
20.42 |
49.16 |
1182.75 |
24.40 |
-2.5 |
Dec ‘14 |
18.45 |
48.59 |
1199.25 |
24.73 |
-3.0 |
Jan ‘15 |
17.40 |
47.69 |
1260.25 |
23.01 |
-3.0 |
Feb ‘15 |
18.17 |
51.49 |
1213.70 |
24.35 |
-1.0 |
Mar’15 |
17.01 |
48.78 |
1187.00 |
24.11 |
-3.0 |
Apr’ 15 |
18.29 |
50.42 |
1180.25 |
24.13 |
-1.5 |
May 15 |
17.71 |
50.61 |
1190.50 |
24.60 |
+0.5 |
Jun’ 15 |
18.00 |
48.39 |
1176.00 |
24.38 |
-1.0 |
Here are the model components and how the prices looked at the end of June compared with two months back and six months back.
Month |
DBC2 |
DBC6 |
XLB2 |
XLB6 |
Gold2 |
Gold6 |
XLF2 |
XLF6 |
Total Score |
|
Lower |
Lower |
Lower |
Higher |
Lower |
Lower |
Higher |
Lower |
|
June 15 |
|
-1 |
|
+1/2 |
|
-1 |
|
+1/2 |
- 1 |
Notice that nine out of the last 10 months have a tendency to show deflation. It’s interesting that in such a climate we get rumblings about the Fed raising interest rates this year — but I’m not sure that’s going to happen. And other countries are certainly trying to export their deflation to the US by devaluating their currencies. See the trend in the dollar below.
Part IV: Tracking the Dollar
The strong rise in the dollar now seems to be over. The US Dollar index made a double top, hit a new short term low in mid-April and then made a modest recovery. The uptrend seems to be over and right now, we seem to have a wide trading range. What’s next? I have no idea as this letter is not about prediction, just what is happening.
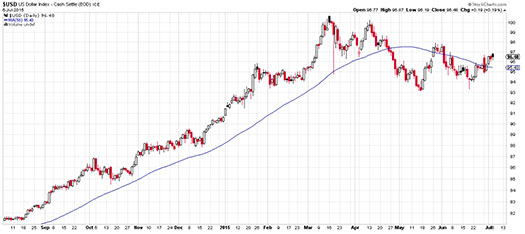
Click here for larger image
Conclusion
A famous trading guru once said that quiet markets are followed by volatile markets and even I am willing to say that. So this sideways quiet market will give way to chaos at some time in the future and that will present some great trading opportunities. We’ll see if that happens this summer or later.
Until next month’s update, this is Van Tharp.
About the Author: Trading coach and author Van K. Tharp, Ph.D. is widely recognized for his best-selling books and outstanding Peak Performance Home Study Program—a highly regarded classic that is suitable for all levels of traders and investors. You can learn more about Van Tharp at www.vantharp.com. His new book, Trading Beyond The Matrix, is available now at matrix.vantharp.com.
Update to the Super Trader Program
Recently, Dr. Tharp announced a price increase that will soon affect new students entering the Super Trader Program. You still have time to apply and be accepted into the program at the current rates!
There is one final opportunity to attend a qualifying workshop and be considered for the program before the price increase. If you haven't yet done so, consider enrolling in Peak Performance 101 in August, 2015!
Click here to read more and see the deadline for the old prices...
Workshops
Combo Discounts available for all back-to-back workshops!
See our workshop page for details.
Trading Tip
June 2015 SQN® Report
by Van K. Tharp, Ph.D.
View on-line to resolve formatting problems
There are numerous ETFs that now track everything from countries, commodities, currencies and stock market indices to individual market sectors. ETFs provide a wonderfully easy way to discover what’s happening in the world markets. Consequently, I now apply a version of my System Quality Number® (SQN®) score to measure the relative performance of numerous markets in a world model.
The Market SQN score uses the daily percent change for input over a 100-day period. Typically, a Market SQN score over 1.47 is strongly bullish and a score below -0.7 is very weak. The following color codes help communicate the strengths and weaknesses of the ETFs in this report:
| |
• |
Dark Green: ETFs with very strong SQN® 100 scores > 1.47 |
| |
• |
Light Green: ETFs with strong SQN 100 scores (0.70 to 1.47). |
| |
• |
Yellow: ETFs with slightly positive Market SQN scores (0 to 0.70). These are Neutral/Sideways |
| |
• |
Brown: ETFs with slightly negative Market SQN scores (0 to -0.7). |
| |
• |
Red: Very weak ETFs that earn negative Market SQN scores (< -0.7).
|
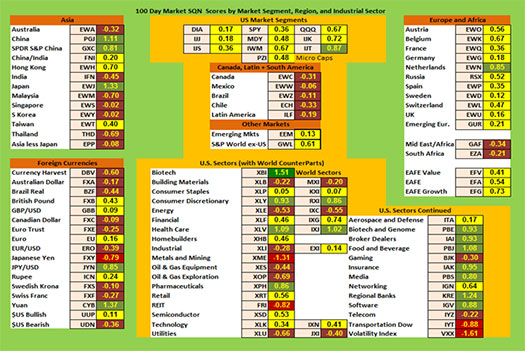
This is basically the same ratings that we use for the Market SQN® Score. The world market model spreadsheet report below contains most currently available ETFs; including inverse funds, but excluding leveraged funds. In short, it covers the geographic world, the major asset classes, the equity market segments, the industrial sectors and the major currencies.
World Market Summary — Equities & Currencies
Each month, we look at the equities markets across the globe by segment, region and sector. This month what we see are very neutral markets across the board. There is nothing exciting. There are only five red sectors and there are no dark green sectors. It’s mostly brown, yellow, and light green. Again, the dollar is no longer the dominant sector and that probably explains what is going on since everything on the chart is relative to the US dollar.
This month all US sectors are yellow except for small cap growth which is light green. The Americas continue to be weak with Canada, Mexico, Brazil, Latin America and Chile all showing negative.
Last month’s dark green sectors in Asia: China, Hong Kong, and Japan have all weakened — Hong Kong actually became yellow. This month, five Asia markets have turned brown: India, Malaysia, Singapore, South Korea, and Thailand.
Despite the Greek crisis in Europe, most of Europe is yellow with the Netherlands being light green. There are no negative markets in Europe.
The US sector view shows some weakening with three red sectors (Metals and Mining, REIT, and Dow Transports). Volatility is also red (meaning there is none). The strongest sectors seem to be biotech, the only dark green sector. These sectors are light green: Consumer Discretionary, Health Care, Pharmaceuticals, Biotech and Genome, Broker Dealers, Food and Beverage, Insurance, Media, Regional Banks and Software.
In the foreign exchange market, the Yuan is now the strongest currency. You might remember that we’ve been talking about how oil might come to be denominated in the Yuan instead of the US dollar. When we first mentioned this, the US dollar was the dominant currency and the Yuan was relatively weak. But since that time we certainly seem to have seen a movement to support that rumor. At this point, the Japanese Yen is the only red currency.
Click here for larger image
Commodities, Real Estate, Debt, Top and Bottom Lists
The next chart shows real estate, debt instruments, commodities and the top and bottom ETFs for the past 100 days.
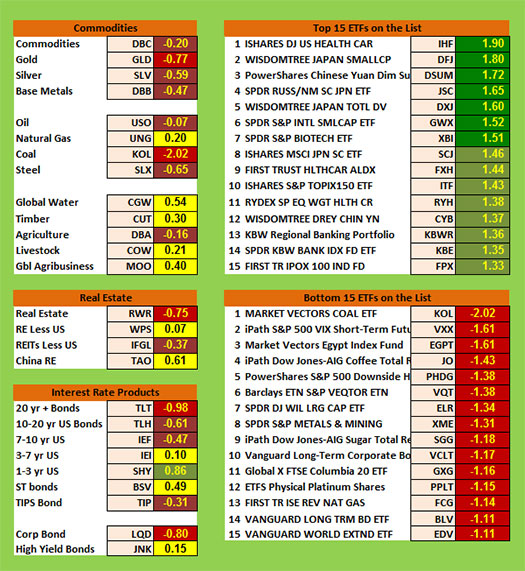
This month there are no green commodities, but there are two red ones 1) Coal and 2) Gold. Five areas are yellow while 7 are negative … so commodities have not been a profitable place to be long.
US real estate now looks weak, and Chinese real estate is getting much stronger.
Debt continued to move down this month, with 20+ year bonds and corporate bonds being red. And only short term bonds are green. The market seems to be expecting higher interest rates.
The top ranking ETFs in the database are weakening again. We have only seven dark green areas and no ETFs are above 2.0. Last month all of the top 15 were dark green and six were above 2.0. Health Care, Japan Small Cap stocks, and the Yuan are the strongest ETFs in the database right now.
The bottom list includes one sector with SQN scores below -2.0 (Coal) and all of them are below negative 1.0.
Summary
Now let’s look at the summary table which measures the percentage of ETFs in each of the strength categories.
Date |
Very
Bullish |
Bullish |
Neutral |
Bearish |
Very
Bearish |
2013 |
> 1.5 |
0.75 - 1.5 |
0 - 0.75 |
0 - -0.7 |
< - 0.7 |
Jan 31st, |
27.1% |
39.6% |
20.7% |
6.4% |
4.7% |
Feb 28th |
10.3% |
45.2% |
24.4% |
11.9% |
7.5% |
Mar 31st |
39.2% |
25.5% |
19.1% |
9.0% |
6.4% |
Apr 30th |
49.1% |
21.1% |
14.8% |
8.0% |
6.2% |
May 31st |
29,2% |
23.6% |
19.9% |
12.3% |
14.2% |
Jun 30th |
2.1% |
31.0% |
23.2% |
22.0% |
20.9% |
Jul 31st |
8.2% |
33.5% |
29.0% |
13.3% |
15.2% |
Aug 30th |
1% |
15% |
46.4% |
19.3% |
17.5% |
Sep 30th |
1% |
13.8% |
42.3% |
23.0% |
19.1% |
Nov 1st |
13.3% |
48.3% |
21.8% |
12.5% |
3.3% |
Dec 1st |
14.6% |
42.7% |
24.2% |
13.3% |
4.3% |
Dec 31st |
19.3.% |
45.5% |
22.0% |
11.3% |
2.9% |
2014 |
|
|
|
|
|
Jan 31st |
8.0% |
49.3% |
20.7% |
12.7% |
7.6% |
Feb 28th |
18.9% |
48.4% |
18.1% |
6.2% |
6.8% |
Mar 31st |
4.9% |
40.2% |
38.8% |
13.3% |
3.1% |
Apr 30th |
11.1% |
33.9% |
40.2% |
11.3% |
1.8% |
May 31st |
12.5% |
46.5% |
27.7% |
7.6% |
6.0% |
Jun 30th |
53.4% |
33.7% |
14.2% |
2.5% |
0.8% |
Aug 29th |
20.3% |
45.2% |
22.8% |
10.5% |
5.3% |
Sep 30th |
6.6% |
26.9% |
30.2% |
24.0% |
18.5% |
Oct 31st |
2.9% |
17.9% |
38.8% |
17.7% |
26.3% |
Nov 30th |
3.1% |
25.7% |
25.1% |
22.8% |
27.9% |
Dec 31st |
3.7% |
29.2% |
24.8% |
15.6% |
31.2% |
2015 |
|
|
|
|
|
Jan 31st |
7.2% |
9.4% |
35.1% |
25.5% |
27.3% |
Feb 28th |
6.4% |
41.1% |
34.5% |
11.5% |
10.9% |
Mar 31st |
2.3% |
24.0% |
46.4% |
19.7% |
12.9% |
April 30th |
1.6% |
13.6% |
69.4% |
15.0% |
5.7% |
May 29th |
5.5% |
37.4% |
41.5% |
14.8% |
4.7 % |
June 30th |
1.4% |
15.8% |
48.5% |
29.0% |
10.7% |
As I have pointed out recently, there has been a strong move toward neutrality and that continued in June.
Be careful to base your actions upon what is happening, not what you think might happen.
Until the July SQN Report this is Van Tharp.
The markets always offer opportunities, but to capture those opportunities, you MUST know what you are doing. If you want to trade these markets, you need to approach them as a trader, not a long-term investor. We’d like to help you learn how to trade professionally because trying to navigate the markets without an education is hazardous to your wealth.
All the beliefs given in this update are my own. Though I find them useful, you may not. You can only trade your own beliefs about the markets.
Matrix Contest
 Enter the Matrix Contest Enter the Matrix Contest
for a chance to win a free workshop!
We want to hear about the one most profound insight that you got from reading Van's new book, Trading Beyond the Matrix, and how it has impacted your life. If you would like to enter, send an email to van@vantharp.com.
If you haven't purchased Trading Beyond the Matrix yet, click here.
For more information about the contest, click here.
Ask Van...
Everything we do here at the Van Tharp Institute is focused on helping you improve as a trader and investor. Consequently, we love to get your feedback, both positive and negative!
Send comments or ask Van a question by clicking here.
Also, Click here to take our quick, 6-question survey.
Back to Top
Contact Us
Email us at van@vantharp.com
The Van Tharp Institute does not support spamming in any way, shape or form. This is a subscription based newsletter.
To change your e-mail Address, e-mail us at info@vantharp.com.
To stop your subscription, click on the "unsubscribe" link at the bottom left—hand corner of this email.
How are we doing? Give us your feedback! Click here to take our quick survey.
Call us at: 800-385-4486 * 919-466-0043 * Fax 919-466-0408
SQN® and the System Quality Number® are registered trademarks of the Van Tharp Institute and the International Institute of Trading Mastery, Inc.
Be sure to check us out on Facebook and Twitter!
 
Back to Top |
|
July 08, 2015 #741

Our Mission
Van's Top-Twelve Favorite Trading Books
Van's Favorite Non-Trading Books
Viewing on-line eliminates spacing, and formatting problems that may be unique to your email program.
Ongoing Contest: Learn how you could win a $50 coupon and a grand prize of a free workshop!

"I base my long-term, monthly rebalancing [core] strategies on research into relative strength and momentum as it relates to broad asset classes."-K Long

A Must Read for All Traders
Super Trader
How are we doing?
Give us your feedback!
Click here to take our quick survey.
From our reader survey...
"I think the newsletter is extremely generous and it is a resource I utilize constantly. I have saved every single one since I first subscribed."
Trouble viewing this issue?
View Online. »
Van Tharp You Tube Channel
Tharp Concepts Explained...
-
Trading Psychology
-
System Development
-
Risk and R—Multiples
-
Position Sizing
-
Expectancy
-
Business Planning
Learn the concepts...
Read what Van says about the mission of his training institute.
The Position Sizing Game Version 4.0
Have you figured out yet how to pick the right stocks? Are you still looking for a high win-rate trading system? When you’re ready to get serious about your trader education, download the Position Sizing Game to learn some true fundamentals of trading success. Learn more.
To Download for Free or Upgrade Click Here

Download the first three levels of Version 4.0 for free:
Register now. »
Trouble viewing this issue?
View Online. »

Dr. Tharp is on Facebook

Follow Van through
Twitter »

Check out our home study materials, e-learning courses, and best-selling books.
Click here for products and pricing
What Kind of Trader Are You? Click below to take the test.
Tharp Trader Test
Back to Top

Introduction to Position Sizing™ Strategies
E-Learning Course
Perfect for auditory/visual learners who learn more effectively from an instructional format that is full of interactive features!
Only $149
Learn More
Buy Now
SQN® and the System Quality Number® are registered trademarks of the Van Tharp Institute
|