Tharp's Thoughts Weekly Newsletter
-
Article: Bear Market Insights by Mark McDowell
-
Workshops: $500 Discount When Attending Back-to-Back in Nov
-
-
Tip: The Halloween Indicator — One That Just Keeps Working by D. R. Barton, Jr.
-
Trading Workshops in November Great for Bear Markets
Day Trading and Live Day Trading with Instructor Ken Long
Learn two complimentary trading systems (and trade them on a simulator in class!) that are great performers in volatile market conditions like we are experiencing right now!
In this three day workshop, Dr. Ken Long lectures on the first day about his general approach to intraday trading and about two specific day trading systems — the Frog and RLCO. You will learn the "why" behind each system and the rules for each. Over the next two days, you put your knowledge to work learning these trading systems the best way possible — actually trading them. Ken will review a series of case studies with you and then you make trades in a simulator — using historical price data. You’ll get plenty of practice so that before you get back home, you have already made numerous trades.
After three action-packed days of instruction and hands-on trading, you can opt to stay an additional two days and trade these systems live! See how these systems trade in real-time in the live markets with a successful, experienced coach in the room guiding you the entire way.
Trading in a Bear Market and Down Markets with Instructor Mark McDowell
Learn how to identify, prepare for, trade during, and profit from the next big bear market—or from any smaller market that’s heading down.
This workshop helps you learn how to think about trading broad bear markets and trading an asset class, sector or even one symbol that is moving down in bear mode. For a major bear market, think equities in 2008-2009. For a down move, think oil in 2014-2015. Imagine having had some ways you could have effectively traded those periods. Major bear markets don’t come that often but “lesser” down moves can be found almost anytime – including during bull markets. Start using the information from this workshop when you return back home — and also be prepared for the next big bear market.
| • |
|
Study in depth the concept of a bear market. |
| • |
|
Learn what a bear market truly is and learn several ways to define and measure the bear market type. |
| • |
|
Know when a bear market type might be starting and how to know when it might end. |
| • |
|
Learn 5 trading strategies suited for bear market conditions. |
| • |
|
Learn how options can be especially useful for bear market types. |
To register or to see the full workshop schedule, click here.
Feature Article
Bear Market Insights
by Mark McDowell
Click here to resolve formatting problems
Is the US stock market in bear mode?
The financial and general news media generally consider a 10% to 20% decline from the peak only a market “correction” and a bear market starts only when the decline exceeds -20%. So no, this crowd does not consider the stock market to be in a bear at the moment.
After researching the topic of bear markets, however, I find the media's definition of bear markets and corrections to be of little if any value. Historically, an average “correction” is -14.4% from peak to trough and lasts an average of 4.5 months (www.stocktradersalmanac.com). Our current -12.5% decline has lasted about 4 months (measured from the peak on May 20, 2015). It’s funny too, when the financial media talks about a bear market, rarely do they mention how long it takes to recover to the prior peak. Did you know it takes an average of almost 38 months for bear markets (using their definition, more than a 20% decline) to return to their prior peak?
So by media standards, we are not in a bear right now — but — the characteristics of the market since late August match those of typical bear markets. Van’s market type clearly shows that we have been in bear market territory since mid-August. Some of the market type classifications that I watch also say it’s a bear market. I believe that the traders who have done well recently are those who switched their trading systems over to ones designed for bear markets. Not only is this group prepared, they are trading and profiting in the current market type.
How can traders determine market type so they can know when to adapt which systems they trade? There is not just one way but rather, there are a number of useful ways to measure market behavior characteristics. For the last 6-8 weeks, the market has moved down and volatility has spiked up — both factors that points to the presence of the "bear" regardless of how you measure either one.
The market type classification approach applies more broadly than to the stock market. You can, however, also monitor other markets, various sectors in the equity market, and even individual stocks or individual ETFs to see what “market type” they are in — regardless of what the whole market is doing. For example, if you had been monitoring American Express (AXP) in the last year, you would not be surprised to learn that it went through a strong bear normal market type earlier in the year, shifted to sideways normal for several months, and recently shifted back to a bear volatile type. In the last year, the stock has been as high as $95, as low as $71, and was at about $77 in the last week.
Coincidentally, AXP is one of several stocks that met the setup criteria in late August for a trading system that works well in bear markets. When the market shifted over to bear, AXP turned out to provide a great Rocks and Rockets trade in late August. On 8/21, AXP was one of the “rocks” that day and as you can see in the intraday chart below, it had a large gap down at the open with a retracement starting in the first 30 to 60 minutes. That retracement failed to follow through and it wound up dropping like a rock into the midday session.
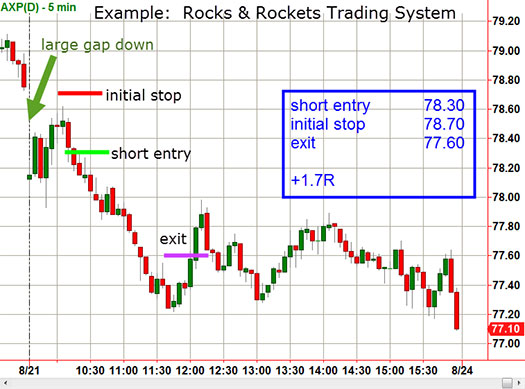
On the morning of 8/21, AXP met the setup criteria for a rock entry and the trade turned out to be something of an average return. Due to the large number of gapping stocks inherent with bear market conditions, this system has been working particularly well lately. With a variation of the rules, however, it becomes a new system which can work well in bull markets. The beliefs about why each system works applies in each market type are similar but the rules for each are different.
Because bear markets behave differently than bull markets, simply reversing rules on your bull market systems will likely not turn them into great bear market systems. Understanding bear markets really helps you recognize the kind of systems that work in bear markets and how to adapt systems to function specifically in those market conditions. In some cases, bull systems just won’t work in a bear even with changes and vice versa, but in other cases, you can find good results.
Timeframe matters too for systems that perform well in bear markets. Because of the volatility, intraday and shorter term systems tend to work well in bear markets. Not all the strategies and systems I have researched and teach, however, are short term. There are some effective systems with longer term positions in bear markets.
Quick Market Check
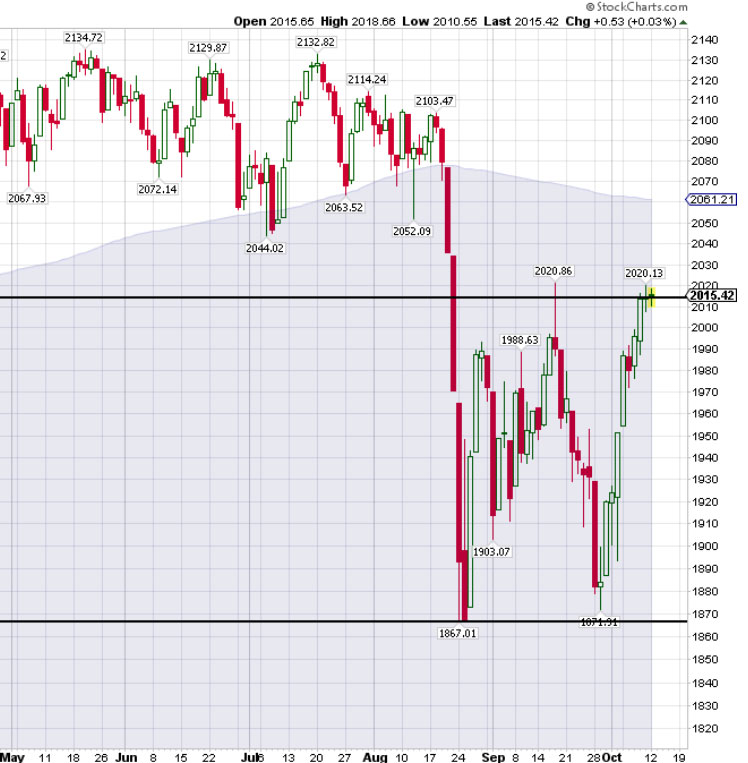
As I'm writing this, SPX (S&P500 index) is moving up and toward the top of the current range (from 1870 to 2020). It's typical for stocks to make large moves up during bear markets. The up moves in a bear market set up "short the rally" opportunities as stocks become overbought. While I can't predict what will happen next, I wouldn't be surprised if the S&P 500 stalls somewhere here around 2014 and then moves down to test the lows again near 1870.

Click here for larger image.
If the index did continue to move up from its current level, it could still take several more months before it gets back to the range of its previous high at 2134. In that area, three possible scenarios emerge — a break through to a new high, a sideways trading range, or rejection and resumption of the downturn.
Remember that figure from the beginning of the article — the average of 38 months return to highs after a 20% or more market decline? Just for speculation, say the market did see a full 20% decline in the next month or so. Based on the historical average, we could expect a return to S&P 500 level of 2134 sometime after New Year’s 2019. As Van likes to say in his Peak workshops, notice your thoughts and feelings. If you are prepared for such conditions with an understanding of bear markets and a portfolio of systems that perform well in a bear, you might be thinking and feeling that would be fine. What’s more, understanding how bear markets end and being prepared for that may be one of the most important market junctures of any type to consider. Are you prepared?
About the Author: Mark McDowell graduated from the Dr. Tharp’s Super Trader Program and has been profitably trading stocks, futures and options full time for several years now. For the better part of a year, Mark extensively researched bear markets and bear market trading strategies. He shares the results of his research in a three-day workshop, Trading in a Bear Market in which he explains strategies and systems for successfully trading each of the three stages of a bear market. The next Trading in a Bear Market workshop will be held in May at the Van Tharp Institute in Cary, North Carolina.
Workshops
Combo Discounts available for all back-to-back workshops!
See our workshop page for details.
Free Book We're Giving You a FREE Book!
TRADING BEYOND THE MATRIX
The Red Pill for Traders and Investors
We pay for the book, you pay for shipping.
ALL YOU HAVE TO DO IS CLICK HERE!
Below is a brief video on how powerful this book is to traders.

Trading Tip

The Halloween Indicator —
One That Just Keeps Working
by D. R. Barton, Jr.
Click here to resolve formatting problems
Normally at this time of year, the only madness that I have to put up with is weird ghoulish stuff on people’s lawns and those those Halloween costume shops that open up for six weeks. The apparently do quite well because in my neck of the woods, they’re stinking everywhere.
But this year it’s a bit different. If I see one more pumpkin flavored anything, I may strangle someone…
I get flavor fads. Pumpkin spice has injected new sales life into lethargic coffee and bagel sales. But now it’s in beer. Every beer. I tried buying some beer as a gift for a friend this morning and I had to walk halfway to the back of the store just to find a beer that was not gourd-infused.
There is pumpkin flavored everything: Peeps, waffles, M&M’s, ice cream and Oreos. Nestle’s even has pumpkin chips (instead of chocolate chips) so you can make your own pumpkin flavored abomination. This seasonal picture sums up everything nicely.

And yet my screams will fall on deaf ears. Pumpkin stuff sells. And so it will persist.
There are lots of pumpkin-flavored spoofs out there, too. I’ve seen pictures of pumpkin flavored KFC, Chipotle burritos, even Remmington buckshot!
Send me the most outrageous pumpkin flavored something you’ve seen at the email listed at the end of article, and we can continue this rant next week with your input!
Now onto something related to Halloween that is actually useful…
The Halloween Indicator: It Just Keeps Working
There is no shortage of Wall Street sayings — but one that has actually proven itself time and again is, “Sell in May and go away….” Many times, old bromides like this fail to stand up to scrutiny. Selling in May and buying back at Halloween (the end of October) is the idea behind “The Best Six Months” seasonal tendency, also called the “Halloween Indicator”. Why do I like this seasonal trend so much? Because it just plain works.
I’ve documented the efficacy of this indicator several times in past years here in Tharp’s Thoughts (most recently in 2012).
Today, I want to revisit one of the first academic papers that validate this phenomenon and then we’ll dig even deeper next week.
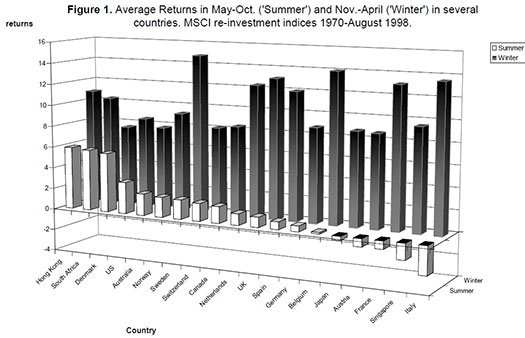
Bouman and Jacobsen published a paper in 2001 in American Economic Review that showed that the November to April time frame outperformed the May to October period by a statistically significant amount. Here is their conclusion:
“Surprisingly, we find this inherited wisdom to be true in 36 of the 37 developed and emerging markets studied in our sample. The ‘Sell in May’ effect tends to be particularly strong in European countries and is robust over time. Sample evidence, for instance, shows that in the UK the effect has been noticeable since 1694.”
The following two charts show how striking the outperformance is across developed countries:
Click here for a larger image.
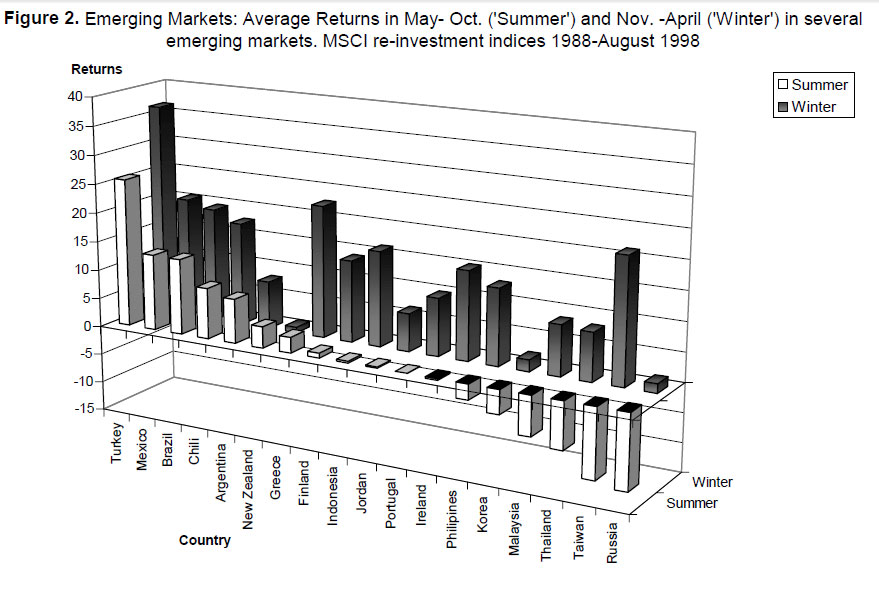
And this one shows similarly impressive results in the emerging markets:
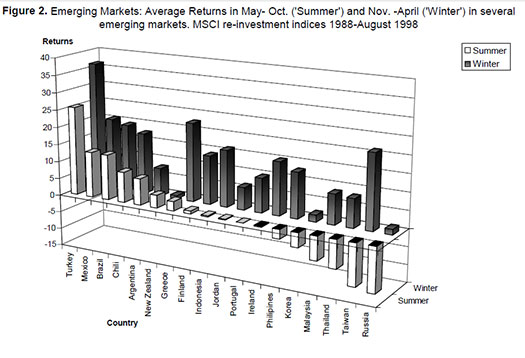
Click here for a larger image.
So as we head into the seasonally strongest “six best months,” I look forward to reviewing the most recent research with you (published just last year) that further confirms the power of the Halloween indicator.
I always love hearing your thoughts and comments (and this week, send the most outrageous pumpkin-flavored something you’ve seen). Send them all to drbarton “@” vantharp.com.
Great Trading,
D. R.
About the Author: A passion for the systematic approach to the markets and lifelong love of teaching and learning have propelled D.R. Barton, Jr. to the top of the investment and trading arena. He is a regularly featured analyst on Fox Business’ Varney & Co. TV show (catch him most Thursdays between 12:30 and 12:45), on Bloomberg Radio Taking Stock and MarketWatch’s Money Life Show. He is also a frequent guest analyst on CNBC’s Closing Bell, WTOP News Radio in Washington, D.C., and has been a guest on China Central Television — America and Canada’s Business News Network. His articles have appeared on SmartMoney.com MarketWatch.com and Financial Advisor magazine. You may contact D.R. at "drbarton" at "vantharp.com".
NEW! Swing Trading Systems E-Learning Course
 We are excited to announce that our new Swing Trading Systems home study course is now available! Learn with Dr. Ken Long as he teaches his Swing Trading Systems Workshop via streaming video! We are excited to announce that our new Swing Trading Systems home study course is now available! Learn with Dr. Ken Long as he teaches his Swing Trading Systems Workshop via streaming video!
This new e-learning course includes Ken Long's Swing Trading Workshop, 5 swing trading systems and a bonus workshop featuring Van Tharp on Tharp Think principles. The course also includes extensive downloadable files to support your learning.
You can complete this course at your own pace, from the comfort of your own home or office, and access the materials as many times as you wish during your 1 year subscription period.
Take a look at this video from Ken to learn more about this course.

We have extensive information about the Swing Trading System e-learning course, including how to purchase...click the link below!
Learn More About This Swing Workshop....
In this six minute video, Ken analyzes several trades from the relatively quiet session on Monday, October 12. He opens with a swing trade that started last week on XIV talking about the entry, initial stop, target, and progress of the trade so far. That swing trade offers the opportunity trade XIV intraday with some confidence in the long bias. Ken provides two tradeable intraday scenarios for the XIV move during the Monday session and the position sizing ramifications for each. Ken then discusses a second trade where one of the traders in the chat room went short USO and earned a couple of R for the effort. 
Matrix Contest
 Enter the Matrix Contest Enter the Matrix Contest
for a chance to win a free workshop!
We want to hear about the one most profound insight that you got from reading Van's new book, Trading Beyond the Matrix, and how it has impacted your life. If you would like to enter, send an email to van@vantharp.com.
If you haven't purchased Trading Beyond the Matrix yet, click here.
For more information about the contest, click here.
Ask Van...
Everything we do here at the Van Tharp Institute is focused on helping you improve as a trader and investor. Consequently, we love to get your feedback, both positive and negative!
Send comments or ask Van a question by clicking here.
Also, Click here to take our quick, 6-question survey.
Back to Top
Contact Us
Email us at van@vantharp.com
The Van Tharp Institute does not support spamming in any way, shape or form. This is a subscription based newsletter.
To change your e-mail Address, e-mail us at info@vantharp.com.
To stop your subscription, click on the "unsubscribe" link at the bottom left—hand corner of this email.
How are we doing? Give us your feedback! Click here to take our quick survey.
Call us at: 800-385-4486 * 919-466-0043 * Fax 919-466-0408
SQN® and the System Quality Number® are registered trademarks of the Van Tharp Institute and the International Institute of Trading Mastery, Inc.
Be sure to check us out on Facebook and Twitter!
 
Back to Top |

