Tharp's Thoughts Weekly Newsletter
-
Feature Article: July 2016 Market Update:
Bull Quiet Market Type, by Van K. Tharp, Ph.D.
-
Workshops: Early Enrollment Disciount Ends Next Week On August Workshops!
-
Trading Tip:July 2016 System Quality Number SM Report, by Van K. Tharp, Ph.D.
-

Extreme Discounts. This Week ONLY.
This is a FLASH sale. That means it ignites quickly and then it's over. You have to take action now to get the offer.
Are you motivated to dig in and sharpen your skills in preparation for the upcoming opportunities in the markets? If so, Dr. Tharp has approved a limited number of discounted workshop packages for traders committed to improvement.
If you act fast (by this Sunday, August 7th), you can get a package discount to attend virtually ANY 5 workshops we offer through the end of 2017 — at an unprecedented low tuition cost per workshop. How does $1,499 per workshop grab you? Yes, that discount applies to workshops that are normally priced at $3,995!
CLICK HERE FOR DETAILS!

Feature Article

July 2016 Market Update:
Bull Quiet Market Type
by Van K. Tharp, Ph.D.
Click here to resolve formatting problems
I always say that people do not trade the markets; they trade their beliefs about the markets. In that same way, I'd like to point out that these updates reflect my beliefs. I find the market update information useful for my trading, so I do the work each month and am happy to share that information with my readers. If your beliefs are not similar to mine, however, then this information may not be useful to you. Thus, if you are inclined to go through some sort of intellectual exercise to prove one of my beliefs wrong, simply remember that everyone can usually find lots of evidence to support their beliefs and refute others. Simply know that I admit that these are my beliefs and that your beliefs might be different.
These monthly updates are in the first issue of Tharp's Thoughts each month which allows us to get the closing data from the previous month. These updates cover 1) the market type (first mentioned in the April 30, 2008, edition of Tharp's Thoughts), 2) the debt statistics for the US, 3) the five-week status on each of the major US stock market indices, 4) our four-star inflation-deflation model, and 5) tracking the US dollar. I also write a report on the strongest and weakest areas of the overall market as a separate SQNSM Report. Significant market changes may mean the SQN Report comes out more than once a month.
Part I: The Big Picture
So what are the markets telling us now?
Over the last 100 days, the S&P 500 is up 9.82% - the period between early March and late July has been pretty good. The Market SQN score for the last 100 days shows a bull market. The other Market SQN periods, however, are reading neutral for 200 days, bull for 50 days, and neutral for 25 days.
Debt Clock
The State of the United States |
Month Ending |
National Debt |
Federal Tax Revenue |
Federal Spending |
Trade Deficit |
Debt Per Family |
Unfunded Liabilities |
Taxpayers |
People supported by them |
July 31 2012 |
$15.93 trillion |
$2.364 trillion |
$3.632 trillion |
$810 billion |
$684,405 |
|
|
|
Dec 30 2012 |
$16.42 trillion |
$2.452 trillion |
$3.540 trillion |
$740.7 billion |
$732,086 |
|
|
|
July 31, 2013 |
$16.89
Trillion |
$2.73
trillion |
$3.535 trillion |
$703 billion |
$748,458 |
Unfunded Liabilities |
115.2 million |
109.9M
95.4% |
Dec 31, 2013 |
$17.27 trillion |
$2,82 trillion |
$3,480 trillion |
$692 billion |
$751,294 |
$127.2 trillion |
115.0 million |
108.5M
94.3% |
Aug 31, 2014 |
$17.70 trillion |
$2.97 trillion |
$3.53 trillion |
$706 billion |
$757,297 |
$118.0
trillion |
116.5 million |
104.5M
90.0% |
Dec 31, 2014 |
$18.04 trillion |
$3.08 trillion |
$3.57 trillion |
$713.2 billion |
$733,741 |
$92.5 trillion |
117.3 million |
104.4M
89.0% |
Jul 31, 2015 |
$18.32 trillion |
$3.15 trillion |
$3.65 trillion |
$723.4 billion |
$753,212 |
$97.2 trillion |
118.7 million |
105.0M
88.4% |
Aug 31, 2015 |
$18.37 trillion |
$3.16 trillion |
$3.66 trillion |
$729.7 billion |
$753,533 |
$97.5 trillion |
118.9 million |
104.9M 88.2% |
Sep 30, 2015 |
$18.41 trillion |
$3.18 trillion |
$3.68 trillion |
$726.6 billion |
$800,855 |
$97.7 trillion |
119.0 million |
105M
88.2% |
Oct 31, 2015 |
$18.43 trillion |
$3.26 trillion |
$3.70 trillion |
$736.9
billion |
$805,560 |
$98.8 trillion |
119.2 million |
105M
88.1% |
Nov 30, 2015 |
$18.71 trillion |
$3.29 trillion |
$3.72 trillion |
$732.4 billion |
$810,044 |
$100.3 trillion |
119.4 million |
105.1M
88.0% |
Dec 31, 2015 |
$18.51 trillion |
$3.30 trillion |
$3.74 trillion |
$731.1 billion |
$789,359 |
$100.7 trillion |
119.6 million |
105.1M
87.9% |
Jan 31, 2016 |
$18.96 trillion |
$3.31 trillion |
$3.76 trillion |
$732.1 billion |
$793,400 |
$101.0 trillion |
119.6
Million |
105.5M
88.0% |
Feb 29, 2016 |
$19.06 trillion |
$3.33 trillion |
$3.78 trillion |
$739.7 billion |
$796,710 |
$101.3 trillion |
119.6 million |
105.6M
88.2% |
Mar 31, 2016 |
$19.20 trillion |
$3.31 trillion |
$3.80 trillion |
$734.6 billion |
$792,131 |
$101.7 trillion |
119.7 million |
105.1
87.8% |
Apr 30, 2016 |
$19.26 trillion |
$3.32 trillion |
$3.82 trillion |
$747.3 billion |
$794,366 |
$101.9 trillion |
119.6 million |
104.8
87.9% |
May 31, 2016 |
$19.28 trillion |
$3.33 trillion |
$3.84 trillion |
$735.4 billion |
|
$102.3 trillion |
119.6 million |
104.7 87.5% |
Jun 30 2016 |
$19.29 trillion |
$3.34 trillion |
$3.86 trillion |
$730 billion |
$804,097 |
$102.7 trillion |
119.7 million |
104.6 87.4% |
Jul 30 2016 |
$19.40 trillion |
$3.35 trillion |
$3.88 trillion |
$738 billion |
$807,414 |
$103.0 trillion |
119.7 million |
103.7 86.6% |
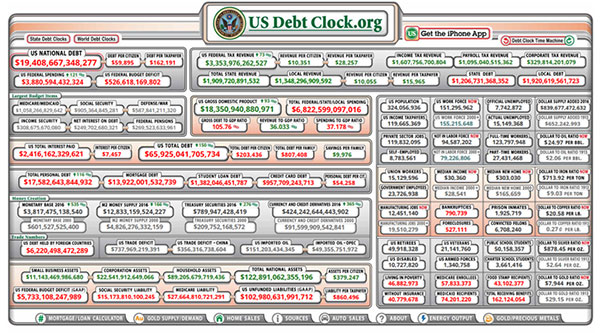
Click Here for Larger Image
In late April 2016, usdebtclock.org said our official debt went over the $19 trillion mark and now we are at $19.4 trillion. So our politicians are doing their usual “wonderful” job of spending our money.
Incidentally, the website says there are 119.7 million U.S. taxpayers. I add together US Retirees (49.9 million) food stamp recipients (43.1 million) and disabled people drawing social security (10.7 million). I don’t think there is any overlap here. Those groups total 103.7 million and that’s why I say that they constitute a group that’s 86.6% of the number of taxpayers. I could also include all government employees (23.7 million) as among those supported by taxpayers — but they do pay taxes. Remember about 10% of the taxpayers (11.97 million) pay most of the tax revenue.
Part II: The Current Stock Market Type Is Bull Quiet
My market type classification is not predictive but descriptive — rather than telling us what’s going to happen, it simply tells us what’s going on now. When you see a trend, you might say, well, right now it’s going down, however, you also know that in a few days the direction could change. The Strong Bull market type at the end of June could have been a fluke based on what happened in the last few days of June and what happened 100 days before that. But now it’s August and we are still in a bull market so be sure you follow what the market is doing not what you thinking it might do. Also, the market made eight new highs in July.
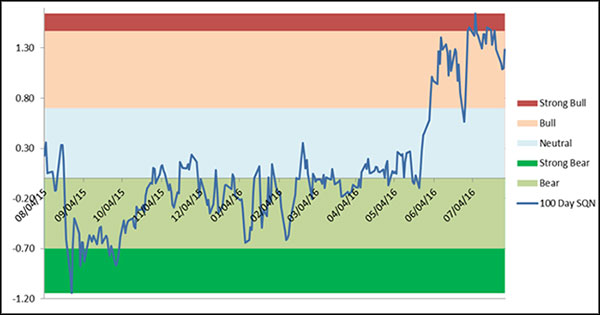
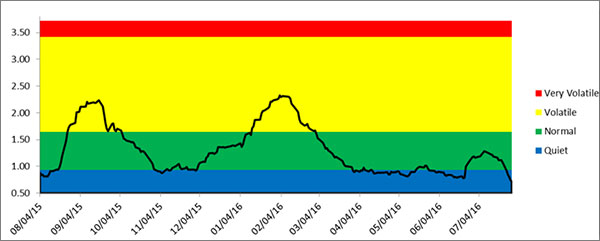
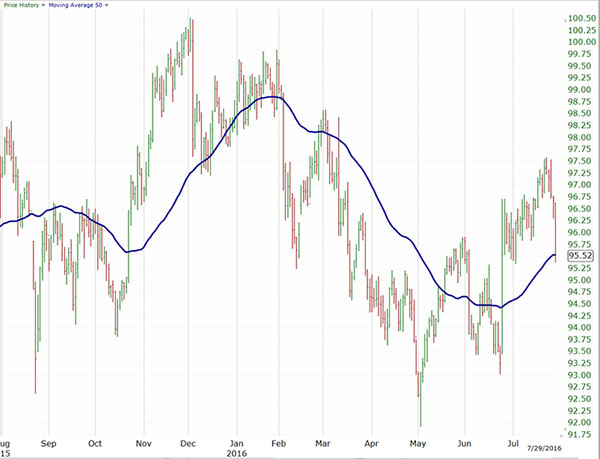
The graphs below include a chart of weekly price bars for the S&P 500 over the last year, the Market SQNSM score for 100 days and the 20 day ATR percent volatility.
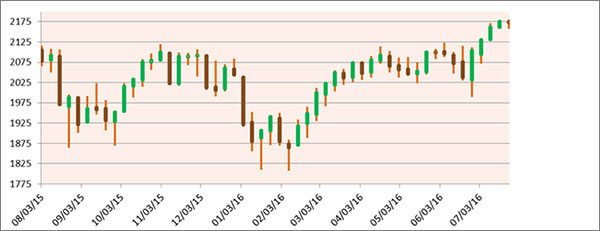
The price chart above shows the S&P has been mostly going up since February and the chart below shows that rise lifted the market SQN score out of bear territory where it spent most of the last year. 2016 is a presidential campaign year and the market usually does well in such years (no matter how bad the candidates might seem).
The third chart shows that the market volatility was right on the borderline between quiet and normal for April, May and much of June. The Brexit drop gave volatility a bump but it finished July well within the quiet range.
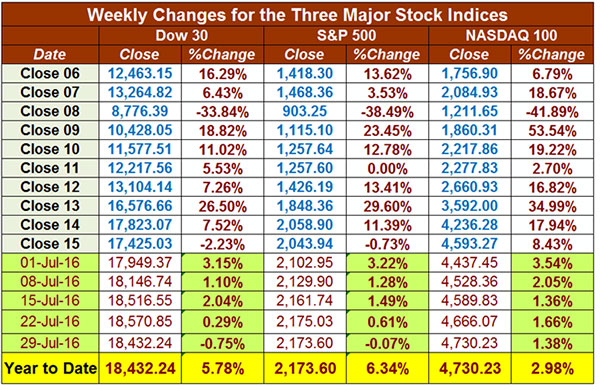
Below is a chart of the recent weekly changes in the three major US Indices. We now have two of our three major indices for the US up slightly for the year. The DOW is up 5.78%, the S&P 500 is up 6.34%, and the NASDAQ is up 2.98%. Clearly, you are missing profits if you are not long in this market.
Part III: Our Four Star Inflation-Deflation Model
In the simplest terms, inflation means that stuff gets more expensive, and deflation means that stuff gets cheaper. There’s a correlation between the inflation rate and market behavior so understanding inflation and deflation can help traders understand some important big-picture processes.
See the tracking table below.
Date |
CCI> DBC |
XLB |
Gold |
XLF |
Total Score |
Dec ‘05 |
347.89 |
30.28 |
513 |
31.67 |
|
Dec ‘06 |
394.89 |
34.84 |
635.5 |
36.74 |
|
Dec ‘07 |
476.08 |
41.7 |
833.3 |
28.9 |
|
Dec ‘08 |
352.06 |
22.74 |
865 |
12.52 |
|
Dec ‘09 |
484.42 |
32.99 |
1,104.00 |
14.1 |
|
Dec ‘10 |
629.53 |
38.47 |
1,410.25 |
16 |
|
Dec ‘11 |
564.37 |
33.5 |
1,574.59 |
13 |
|
Dec ’12 CCI>DBC |
556.08
27.79 |
37.54 |
1,564.80 |
16.39 |
1 |
Dec ‘13 |
25.66 |
46.22 |
1201.50 |
21.86 |
-1.5 |
Dec ‘14 |
18.45 |
48.59 |
1199.25 |
24.73 |
-3.0 |
Jun ’15 |
18.00 |
48.39 |
1176.00 |
24.38 |
-1.0 |
Jul ’15 |
15.73 |
45.94 |
1098.40 |
25.18 |
-2.5 |
Aug ’15 |
15.69 |
43.36 |
1135.00 |
23.42 |
-2.5 |
Sep ‘15 |
15.15 |
39.95 |
1114.00 |
22.66 |
-2.0 |
Oct’ 15 |
15.20 |
45.28 |
1142.35 |
24.08 |
-1.5 |
Nov’ 15 |
14.19 |
45.57 |
1061.90 |
24.56 |
-2.0 |
Dec’ 15 |
13.36 |
43.42 |
1062.25 |
23.83 |
-2.0 |
Jan’ 16 |
12.78 |
38.77 |
1111.80 |
21.72 |
0.0 |
Feb ‘16 |
12.75 |
41.80 |
1234.90 |
21.09 |
0.0 |
Mar’ 16 |
13.29 |
44.81 |
1237.00 |
22.50 |
+2.0 |
Apr’ 16 |
14.58 |
47.10 |
1292.40 |
23.31 |
+2.0 |
May 16 |
14.71 |
46.94 |
1216.25 |
23.75 |
+3.0 |
Jun 16 |
15.35 |
46.34 |
1320.75 |
22.86 |
+3.5 |
Jul 16 |
14.28 |
48.69 |
1350.40 |
23.65 |
+2.0 |
Here are the model components and how the prices looked at the end of February compared with two months back and six months back.
Month |
DBC2 |
DBC6 |
XLB2 |
XLB6 |
Gold2 |
Gold6 |
XLF2 |
XLF6 |
Total Score |
|
Lower |
Higher |
Higher |
Higher |
Higher |
Higher |
Lower |
Higher |
|
Jul 16 |
|
+1/2 |
|
+1 |
|
+1 |
|
-1/2 |
+2.0 |
So with July, now we have five straight inflationary months. This indicates a clear new trend and reveals that the value of your money is going down while things like gold and commodities are going up. We are clearly seeing a major change in the economy from what we’ve had over the last several years. My guess is that this year will be an exciting time for making money especially since the average person is afraid of the market, is no longer buying trading books, and is generally sitting on the sideline. That’s when the well prepared and attentive can make the most money.
Part IV: Tracking the Dollar
The US Dollar Index was falling throughout most of March and April and went as low as 92 at the end of May. Then it began to rise but it has been volatile. The Brexit vote caused a huge up day and then USD continued to rise until the end of July when it fell sharply for several days. Perhaps the reason is that now the world knows who our two presidential candidates are. While the US Dollar is known as a safe haven currency, its current 100 day Market SQN score is bearish at -0.33.
Click Here for Larger Image
Conclusion
The stock market had a huge two day down reaction to Brexit and then went up strongly in the following days and throughout July. There are some interesting potential pitfalls ahead of us in this election year. First, Hillary Clinton won’t be indicted but she still has very big problems as a candidate. In my opinion, she is probably the most corrupt presidential candidate we have ever had (and my opinion that she was corrupt began back when her husband was running for president). Do you remember the Hillary commodity trading account? Professional traders looked at those trades and stated they were impossible results — but it was a good way for her to get kickbacks. And ask her what happened to Vince Foster (if you are old enough to remember those days). Well her behavior hasn’t changed at all over the years. Doug Casey has recently pointed out that Clinton is the biggest war monger we’ve ever had running for president (Trump just sounds like it, but look at Hillary’s track record). Casey is afraid that Hillary as president will result in World War III. I certainly hope that isn't the case.
On the Republican side, we have a wildcard. My guess is that Trump started running for president primarily for publicity but then he found that he could actually win by making outlandish statements. He is a former democrat and a good friend of the Clintons, so he could be running to ensure that Hillary Clinton gets elected. But then again, he might just win. So we have a choice between the most corrupt candidate ever and someone who sounds like the stupidest candidate ever.
Even with these two candidates, however, the markets are going up. You can be long until the markets stop going up. It’s not that difficult unless your mind gets in the way and tells you to do the opposite of what the market is doing.
Trading books are not selling at all (that’s why I haven’t published another one in a while) and people are staying away from the market in droves. This market has been driven by corporate buybacks and by the Fed putting cash into the market. The individual investor is not in this market at all. He/she is scared — and at a time when some of the best money can be made, but isn’t that typical?
Are you scared of this market? Then you might miss the amazing opportunities to make big money just ahead of us. You need to work on your psychological issue (fear is not equal to happiness) and educate yourself so you can take advantage of the great opportunities ahead. And if you think a bear market is around the corner, then be prepared to trade it rather than sitting it out. We have a workshop about bear markets in two weeks on how to capitalize on such conditions when they occur. Don’t miss this workshop (you can get a huge discount with our workshop flash sale this week only).
My Road Trip Adventure
On July 19, I started a 9,000-mile road trip in my Tesla and I’m currently in Las Vegas.
Last week, I was in Oklahoma where I met an old friend who is now a full professor at the University of Oklahoma Health Sciences Center (where I got my Ph.D.). As we were leaving Oklahoma City on Interstate 40, we hit a patch of rough road at freeway speeds (about 55 mph) and I heard a loud bang as the bottom of my car hit a pothole. (When I lived there in the 1970’s, Oklahoma used to be known as the pothole capital of the world.) The next thing I knew the right front tire had zero tire pressure and a six-inch gash in the side. The disaster also produced a bubble in the rear right tire so I had to replace two tires (luckily I was able to replace both). In addition to the tire damage, the service people told me the right front tire rim was bent — but that I could drive on it temporarily. I drove another 1,200 miles to Las Vegas, replaced the two other tires, and then found out that the left front rim was also bent. So now in addition to all four tires, I had to also replace two front wheels — for a huge pothole in an Interstate for which there was no warning. The best news is that I did not replace the worn front tires before I left North Carolina (the Tesla dealership in NC thought I could get to at least Las Vegas before needing new ones). Had I replaced the tires before leaving, I would have had to scrap one or two brand new tires because of the Oklahoma City pothole. Other good news — I discovered that I could replace $600 tires from Tesla instead at discount tire stores for about half the price and they come with a warranty against such pot holes.
We will be in California soon where among other stops, I will spend nine days at the University of Santa Cruz attending an NLP modeling workshop. Here is our planned route in the map below.

I’ll be writing more about the trip after I return in September. Until next month’s update, this is Van Tharp.
About the Author: Trading coach and author Van K. Tharp, Ph.D. is widely recognized for his best-selling books and outstanding Peak Performance Home Study Program — a highly regarded classic that is suitable for all levels of traders and investors. You can learn more about Van Tharp at www.vantharp.com. His new book, Trading Beyond The Matrix, is available now at matrix.vantharp.com.
Workshops
Combo Discounts available for all back-to-back workshops!
See our workshop page for details.
Trading Tip
July 2016 System Quality NumberSM Report
The SQNSM Report
by Van K. Tharp, Ph.D.
Click here to resolve formatting problems
There are numerous ETFs that now track everything from countries, commodities, currencies and stock market indices to individual market sectors. ETFs provide a wonderfully easy way to discover what’s happening in the world markets. Consequently, I now apply a version of my System Quality NumberSM (SQNSM) score to measure the relative performance of numerous markets in a world model.
The Market SQN score uses the daily percent change for input over a 100-day period. Typically, a Market SQN score over 1.47 is strongly bullish and a score below -0.7 is very weak. The following color codes help communicate the strengths and weaknesses of the ETFs in this report:
- Dark Green: ETFs with very strong SQNSM 100 scores > 1.47
- Light Green: ETFs with strong SQN 100 scores (0.70 to 1.47).
- Yellow: ETFs with slightly positive Market SQN scores (0 to 0.70). These are Neutral/Sideways
- Brown: ETFs with slightly negative Market SQN scores (0 to -0.7).
- Red: Very weak ETFs that earn negative Market SQN scores (< -0.7).
This is basically the same rating scale that we use for the Market SQNSM Score in the Market Update. The world market model spreadsheet report below contains most currently available ETFs; excluding inverse funds and leveraged funds. In short, it covers equity markets around the globe, major asset classes, equity market segments, industrial sectors, and major currencies.
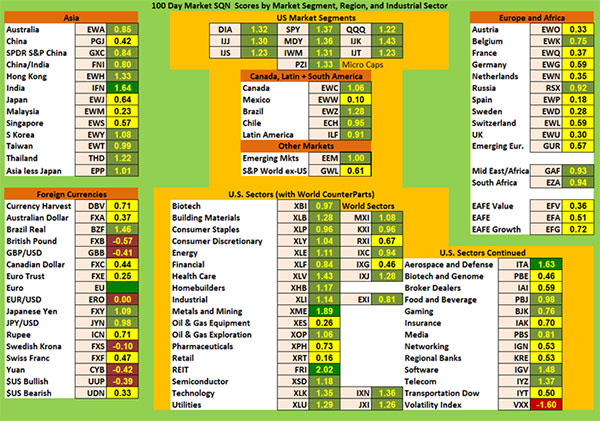
World Market Summary — Equities & Currencies
Each month we look at the equities markets across the globe by segment, region, and sector. This month everything is mostly green and yellow. Everything in the Americas is light green now, however, last month everything in the Americas was dark green (except QQQ which was light green).
In our far left Asia region section of the model, India is the only dark green market (last month Hong Kong was the only dark green) and most of the other areas there are light green. The only exceptions are China, Japan, Singapore, and Malaysia which are all yellow.
This month Europe was mostly yellow with two light green countries, Belgium and Russia. Emerging Africa and South Africa are also both light green.
The US sector view is quite positive compared with what we have seen recently — almost everything is green. There are three dark green areas: Metals and Mining; REITS, and Aerospace and Defense (perhaps someone here knows about Hillary Clinton’s track record as a war monger?). The yellow areas include Oil and Gas Equipment, Pharmaceuticals, Retail, Biotech and Genome, Broker Dealers, Insurance, Networking and Regional Banks. One area is red … VXX because volatility is going down. Three very strong sectors with Market SQN scores over 2.0 include Metals & Mining, REITs and Telecom.
In currencies, two are light green — the Brazilian Real and the Japanese Yen. The two major commodity currencies (the Aussie and Canadian dollars) have fallen back again. There are now five brown currencies including the British Pound (which you’d expect after Brexit), the Euro, the Krona, the US Dollar and the Yuan.
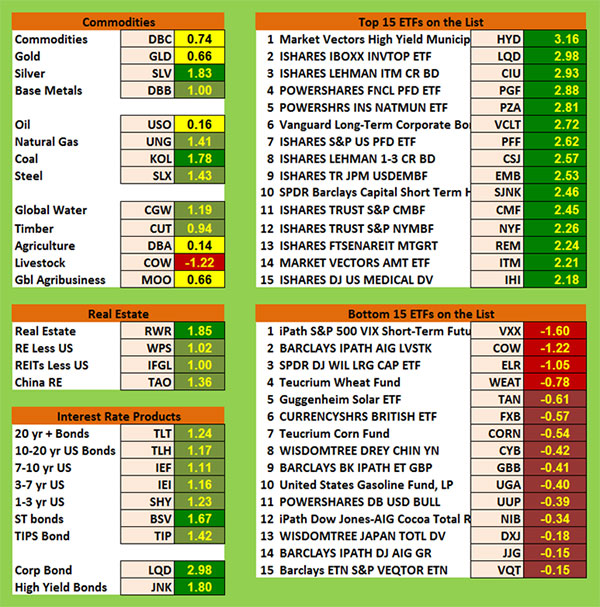
Commodities, Real Estate, Debt, Top and Bottom Lists
The next chart shows real estate, debt instruments, commodities and the top and bottom ETFs for the past 100 days.
The whole commodities section illustrates what the inflation-deflation model in the Market Update articles has been showing for the last five months — we are again in an inflationary environment. Silver and Coal are dark green. Light green commodities include Base Metals, Natural Gas, Steel, Global Water, and Timber. Not sure what’s happened to livestock but it is now red. Real estate is also green.
Debt instruments are all green and that’s almost reversed from what it has been. Suddenly big money likes junk bonds and corporate debt and short-term debt.
The top ranking ETFs in the database are now all dark green with one (high yield munis) being over 3.0. All of them are over 2.0. Municipal bonds are still leading the pack.
In the bottom ranking list in May, there were nine red ETFs but two months later, there are only four red — and only three of them are worse than -1.0. Wheat, Livestock, and VXX are among the worst. July’s list could probably have been met by just number 15 on the bottom ETF list — VQR with a market SQNSM score of only -0.15.
Summary
Now let’s look at the summary table which measures the percentage of ETFs in each of the strength categories.
Date |
Very
Bullish |
Bullish |
Neutral |
Bearish |
Very
Bearish |
2013 |
> 1.5 |
0.75 - 1.5 |
0 - 0.75 |
0 - -0.7 |
< - 0.7 |
Jan 31st, |
27.1% |
39.6% |
20.7% |
6.4% |
4.7% |
Feb 28th |
10.3% |
45.2% |
24.4% |
11.9% |
7.5% |
Mar 31st |
39.2% |
25.5% |
19.1% |
9.0% |
6.4% |
Apr 30th |
49.1% |
21.1% |
14.8% |
8.0% |
6.2% |
May 31st |
29,2% |
23.6% |
19.9% |
12.3% |
14.2% |
Jun 30th |
2.1% |
31.0% |
23.2% |
22.0% |
20.9% |
Jul 31st |
8.2% |
33.5% |
29.0% |
13.3% |
15.2% |
Aug 30th |
1% |
15% |
46.4% |
19.3% |
17.5% |
Sep 30th |
1% |
13.8% |
42.3% |
23.0% |
19.1% |
Nov 1st |
13.3% |
48.3% |
21.8% |
12.5% |
3.3% |
Dec 1st |
14.6% |
42.7% |
24.2% |
13.3% |
4.3% |
Dec 31st |
19.3.% |
45.5% |
22.0% |
11.3% |
2.9% |
2014 |
|
|
|
|
|
Jan 31st |
8.0% |
49.3% |
20.7% |
12.7% |
7.6% |
Feb 28th |
18.9% |
48.4% |
18.1% |
6.2% |
6.8% |
Mar 31st |
4.9% |
40.2% |
38.8% |
13.3% |
3.1% |
Apr 30th |
11.1% |
33.9% |
40.2% |
11.3% |
1.8% |
May 31st |
12.5% |
46.5% |
27.7% |
7.6% |
6.0% |
Jun 30th |
53.4% |
33.7% |
14.2% |
2.5% |
0.8% |
Aug 29th |
20.3% |
45.2% |
22.8% |
10.5% |
5.3% |
Sep 30th |
6.6% |
26.9% |
30.2% |
24.0% |
18.5% |
Oct 31st |
2.9% |
17.9% |
38.8% |
17.7% |
26.3% |
Nov 30th |
3.1% |
25.7% |
25.1% |
22.8% |
27.9% |
Dec 31st |
3.7% |
29.2% |
24.8% |
15.6% |
31.2% |
2015 |
|
|
|
|
|
Jan 31st |
7.2% |
9.4% |
35.1% |
25.5% |
27.3% |
Feb 28th |
6.4% |
41.1% |
34.5% |
11.5% |
10.9% |
Mar 31st |
2.3% |
24.0% |
46.4% |
19.7% |
12.9% |
April 30th |
1.6% |
13.6% |
69.4% |
15.0% |
5.7% |
June 30th |
1.4% |
15.8% |
48.5% |
29.0% |
10.7% |
July 30th |
0% |
7.2% |
49.7% |
39.0% |
9.4% |
Aug 31st |
0% |
0.4% |
7.6% |
49.7% |
42.3% |
Sept 30th |
0% |
2.7% |
7.6% |
42.7% |
39.8% |
Oct 31st |
1% |
6.0% |
19.5% |
51.3% |
22.2% |
Nov 30th |
0.8% |
3.1% |
38.0% |
42.1% |
16.0% |
Dec 31st |
1.4% |
1.6% |
16.8% |
56.1% |
24.2% |
2016 |
|
|
|
|
|
Jan 31st |
1.9% |
7.0% |
27.5% |
48.5% |
15.0% |
Feb 29th |
1.6% |
5.7% |
18.5% |
51.9% |
22.4% |
Mar 31st |
5.8% |
9.2% |
27.5% |
46.6% |
10.9% |
Apr 30th |
7.4% |
12.7% |
42.3% |
37.4% |
2.7% |
May 31st |
5.1% |
34.3% |
50.3% |
8.6% |
1.8% |
June 30th |
43.5% |
35.5% |
16.0% |
4.1% |
1.0% |
July 29th |
16.6% |
54.6% |
25.3% |
4.7% |
0.8% |
Last month, 43.5% of the ETFs we track were strong bull and 79% were bullish. Now only 16.6% are strong bull, but 71.2% are still bullish. Last month 5.1% of the ETFs were bearish which hasn’t changed much this month with 5.5% being bearish.
Be careful to base your actions upon what is happening, not what you think might happen.
Until next month, this is Van Tharp.
The markets always offer opportunities, but to capture those opportunities, you MUST know what you are doing. If you want to trade these markets, you need to approach them as a trader, not a long-term investor. We’d like to help you learn how to trade professionally because trying to navigate the markets without an education is hazardous to your wealth. All the beliefs given in this update are my own. Though I find them useful, you may not. You can only trade your own beliefs about the markets.
Free Book
FREE Book! We pay for the book, you pay for shipping.
Read Van’s Latest book —
TRADING BEYOND THE MATRIX
The Red Pill for Traders and Investors
ALL YOU HAVE TO DO IS CLICK HERE!
Eleven traders tell their stories about transforming their trading results and lives, in this 400 plus page book.
Below is a brief video on how powerful this book is to traders.

Swing Trading Systems E-Learning Course

Ken Long's systematic approach to swing trading with 5 distinct trading systems. This course has over 10 hours of instruction with significant follow-along documents included for students to download.
Review the videos as many times, and as often as you like, for one full year. Plus, you receive a bonus workshop at no extra charge—Dr. Van Tharp's Tharp Think Essentials!
You can complete this course at your own pace, from the comfort of your own home or office, and access the materials as many times as you wish during your 1-year subscription period.
Take a look at this video from Ken to learn more about this course.

We have extensive information about the Swing Trading System e-learning course, including how to purchase...click the link below!
Learn More About The Swing E-Learning Course...
Matrix Contest
 Enter the Matrix Contest Enter the Matrix Contest
for a chance to win a free workshop!
We want to hear about the one most profound insight that you got from reading Van's new book, Trading Beyond the Matrix, and how it has impacted your life. If you would like to enter, send an email to van@vantharp.com.
If you haven't purchased Trading Beyond the Matrix yet, click here.
For more information about the contest, click here.
Ask Van...
Everything we do here at the Van Tharp Institute is focused on helping you improve as a trader and investor. Consequently, we love to get your feedback, both positive and negative!
Send comments or ask Van a question by clicking here.
Also, Click here to take our quick, 6-question survey.
Back to Top
Contact Us
Email us at van@vantharp.com
The Van Tharp Institute does not support spamming in any way, shape or form. This is a subscription based newsletter.
To change your e-mail Address, e-mail us at info@vantharp.com.
To stop your subscription, click on the "unsubscribe" link at the bottom left—hand corner of this email.
How are we doing? Give us your feedback! Click here to take our quick survey.
Call us at: 800-385-4486 * 919-466-0043 * Fax 919-466-0408
SQN® and the System Quality Number® are registered trademarks of the Van Tharp Institute and the International Institute of Trading Mastery, Inc.
Be sure to check us out on Facebook and Twitter!
 
Van Tharp Home • Products • Workshops • Back Issues • Contact • About Van Tharp • Site Map ———————
Back to Top |

