First, a  happy, healthy and prosperous New Year to you all! happy, healthy and prosperous New Year to you all!Next, here’s what I’m concentrating on right now in the equities markets — and it’s all jammed into one chart. Let’s look at 7 steps of market evolution since mid 2-18 and then let’s talk about what we’ll do to make some money. First, the chart: |
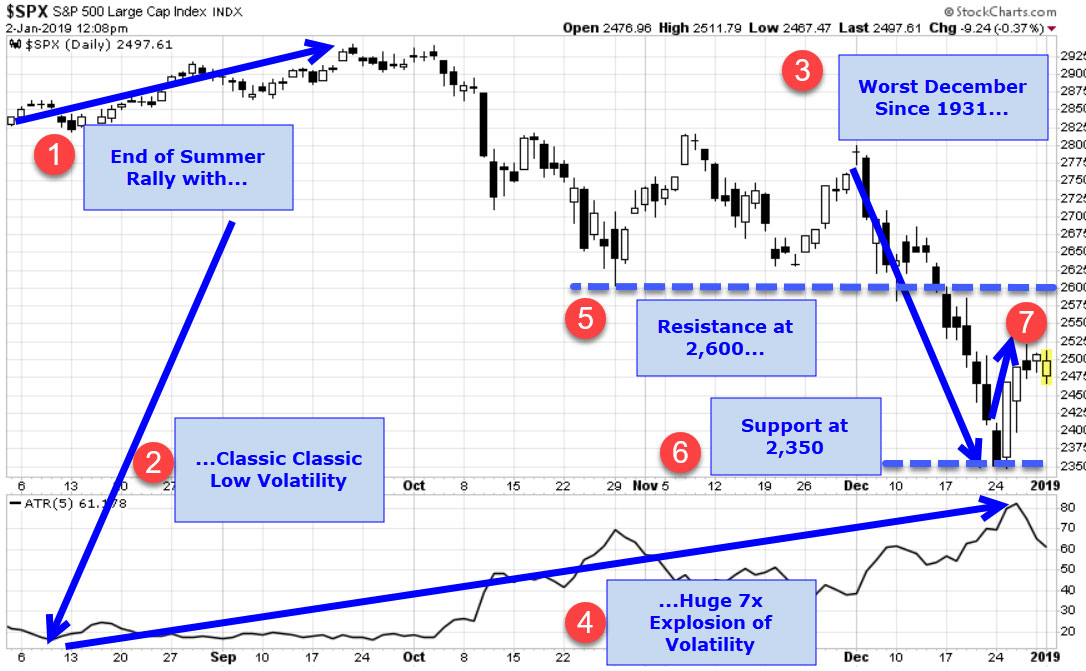 |
The 7 Steps to Today’s Market
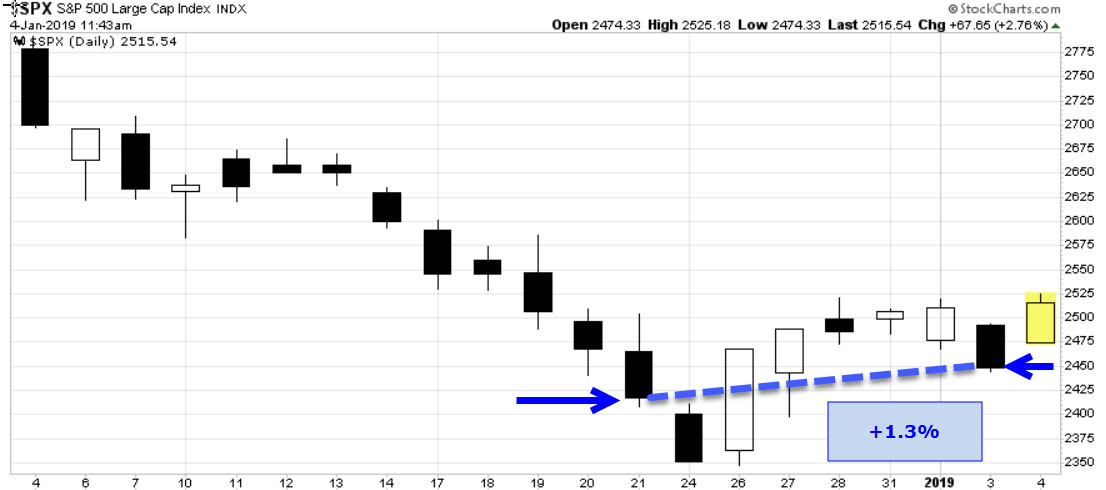
Here’s a little more detail on that Santa Claus Rally: from the close of December 21, 2018 to the close of January 3, 2019, the S&P 500 gained 1.3% — even with the big down moves on the first and last days of that seven day period: |
 |
The Bottom Line We need to remain nimble and prepared to play both sides of this market by taking profits on drops (using short sales and puts) and pops (with fast purchases and calls). It would not be surprising to see a near-term overbought market pause or pullback on this first test of the key resistance level at 2,600. If the market powers through 2,600, then the stage is set for a short-term melt up. Your thoughts and comments are always welcome — please send them to drbarton “at” vantharp.com Great trading and God bless you, D. R. |
Very informative and excellent structure of content material, now that’s user pleasant (:.
Just a smiling visitor here to share the love (:, btw outstanding pattern.