Secrets of Successful Short-Term Trading By, Mark Boucher
There are some key concepts and principles to successful short-term trading that can catapult your trading success if you apply them consistently. We teach many of these in our short-term trading course, but I’m going to relate a few very important ones to you in this article today.
The first principle I want to relate to you today is one I was originally exposed to from the work of W.D. Gann. Quite early in my trading career, I made the trek from Menlo Park, California, where I lived, to Pomeroy, Washington. In Washington, a man named Billy Jones had bought the entire library of life-documents and notes of the late W.D. Gann and was trying to figure them out. I went for a Gann-Trader seminar and paid $500 per extra day to stay afterward and look through and research Gann’s documents.
I did get exposed to a key secret of trading success from this research. Although I wasn’t really ready for it at the time, and it was only years later when I was exposed to something similar that the meaning of it finally clicked in my head.
Other researchers had put together a series of interviews over more than two decades that the great trader Gann had given to a journalist. Over many years, and more than 30 such interviews, Gann had repeatedly shown the journalist developing “trades” of a sort. He would say things like, “ABC stock should hold level A and not fall to level B and then begin to move higher to level C.” Or, “If ABC stock breaks over level A, it should move much higher to level B and not fall to level C on its way.” Over the series of 30 or so interviews, that spanned decades, Gann’s predictions or trades had shown stock movement of substance about 80% of the time, and a very decent average return/risk ratio of over 4R in these statement-trades.
In the final interview of the series, Gann again gave the journalist a number of “trades”, but by this time, the journalist understood that they were trades he was being given. Gann would generally give him five or so such situations. This time, after giving him four such potential trades, the journalist intervened. The journalist said something like, “All of these stocks have already moved up quite a bit. Do you have any buys that are closer to a bottom?” Gann then laughed so hard he pounded the table, and the journalist got quite offended. Then Gann looked him in the eyes and said something like, “It’s funny you ask that because that’s what most people would think.” Gann then added, “But I have just gone back over many decades of my trades and found that if I had just traded stocks that were above my 4X1 angle, and have already moved up quite a bit, my profits would have been much greater, and my losses much smaller than all the other trades put together.”
I copied this and took notes on it, but I didn’t fully comprehend the key lesson Gann was relating, which is actually one of the most important secrets to successful short-term trading. Many years later, a partner and I were contracting for hedge funds and bank trading departments in Switzerland to help them improve what they were doing. Finally, the power of Gann’s message fully hit home.
By coincidence, we got two new clients at roughly the same time. One was a Bank in Lugano that had spent tens of millions of dollars developing its trading-investing strategy. They’d hired top Ph.D.’s in Mathematics and Physics, and Economics to build and maintain it. They had ten full-time people on it all the time. The second client was a two-man, one secretary/accountant operation hedge fund. When we looked at many years of actual trades from these clients, and calculated the numbers, we were shocked to find that the two-man operation had much higher profits (35%+ average annual gains over 15 years), much more consistent profits (no losing years), with much lower and shorter duration drawdowns (max drawdown of under 15%). Essentially, the two-man operation was kicking the much bigger and well-funded firm’s ass in terms of every performance metric for the last decade of real-time historical trades and performance characteristics.
And when I drilled down into what the two-man hedge fund was doing to find and filter its trades, it suddenly hit me. They were doing their own version of exactly what Gann had been saying to that journalist. The two-man operation was exclusively trading top relative strength stocks, commodities, currencies and mutual funds (the ETF’s of the day) that had recently broken out of 5wk+ bases, that were either making new all-time highs or had lots of room to next monthly resistance, and that were holding above the 20EMA post-breakout and continuing to make higher highs and higher lows above that level. This pretty much lined up with Gann’s 4X1 angle he referred to in his interview. What I found in researching this principle was that it is even more important to successful short-term trading than to intermediate-term trading, although it is helpful to both. Please let that concept sink in.
Don’t spend your time trying to find stocks that are bottoming or where you think the market is going. Spend your time simply trying to find stocks (or trading vehicles) that are running, either higher or lower, in a very strong trend, and go with that trend. The steeper the mean line trend, the better, as long as positive technical attributes are being maintained. Only trade instruments that are runaway trending higher or lower, long or short, and don’t risk your capital on anything else. Instruments that are running have higher average R’s when you are right, and that keeps profits high and makes new highs. That also keeps drawdowns low and short. A key to making profits strong and drawdowns low is only focusing on runaway trends with room to go.
Let’s look at some recent examples of what we’re talking about from our monthly top ETF lists published each month in PSL and updated each day in the Reedstrader Daily Report. We like flags and other small consolidation patterns after the breakout as ways of simply illustrating our entries and exits, and ops’s for getting on these trends as a starting point for trading them easily. We refine and improve our entries and ops’s to get risk much smaller in our actual short-term trading course, but just by keeping it simple, you can see the value of the principle we’re talking about.
FNGS is an ETF that has been on our lists for many months, and it’s no secret that Fang’s big-cap growth stocks have been leading this rally for some time. No rocket science. Just identification of a strong trend. On May 10th, 2023, FNGS on our lists broke out of a 5-week base to new rally highs (see chart below). On the lower panel of the chart, we see the monthly chart. We use a 6 pivot on the monthly to define the next resistance. A six-pivot high is simply a bar with six lower highs on both sides of it. The last 6 pivot high on the monthly chart on FNGS was at its all-time high of 35.26. This is where we would expect even a strong uptrend to run into trouble, and so it serves as our potential objective. We want at least 20% before the next resistance level on a monthly chart to say that the trade has potential room. We also want at least 3 to 1 reward-to-risk ratio in our trade, and preferably a 5 to 1 to the potential objective. The ideal trade is one making new all-time highs, that doesn’t have monthly resistance overhead at all.
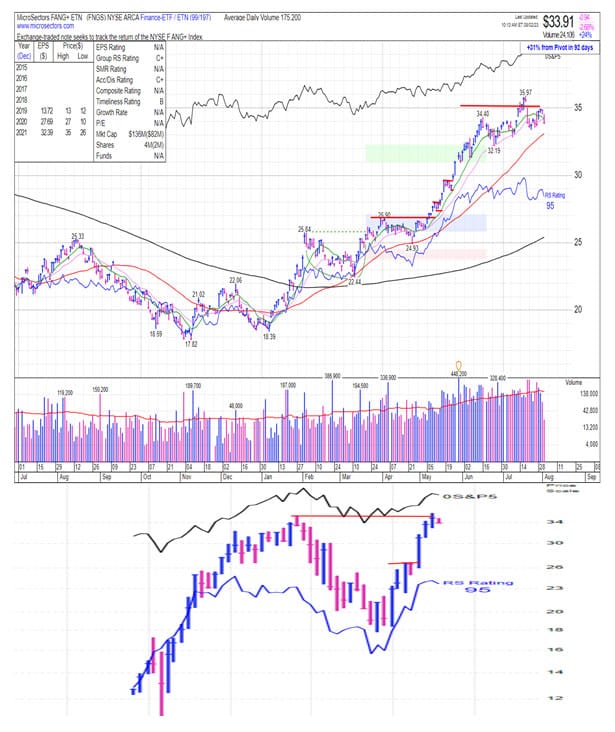
FNGS breaks out above 26.90, with the next six pivot on the monthly chart marking resistance at 35.25, more than 20% higher, and giving any short-term trade room to run to that level. Courtesy MarketSmith.com
We got three days higher after the May 10th breakout in FNGS, and then prices consolidated in a tight flag pattern for the next couple of days as prices stayed way over the 20 EMA from the breakout point. We basically buy all small consolidations that have tight stops on breakouts above them and use the tight consolidation low as our initial ops, as a simple illustration. So, the move 10 ticks above the flag high of 27.97 on May 16th, on a 28.07 stop, got us in. And we use a protective stop-loss (ops) below the flag consolidation low of 10 ticks under the low of 27.42. So, May 16th bought 28.07 with a 27.32 ops for a 0.75 tick risk. Our potential target was 35.26—7.19 points above, which would be a 9.5R profit if hit. That’s more than our 5 to 1 good trade and more than our 3 to 1 minimum, so it’s a good trade. We’ll use a trailing stop, an ATR:14 under the 20EMA, when this level rises above our original protective stop level.
We get another small consolidation after FNGS makes new rally highs a few days later—this time with a high of 29.64 and a low of 28.88. If we buy again, it will be on a 29.74 stop with a 28.78 ops for a 0.96 risk. To our 35.26 objective would be a potential 5.52 profit, which would be a 5.75 R trade, meeting our desired reward/risk parameters. Our stop is triggered on a gap up at 30.09 on May 25th. Now this is a 5.17 potential profit but a 1.31 point risk, which is only a 3.94 R potential trade. We can take this, but no trades lower than 3 R. And if we have other trades that are above 5 R, we’ll prefer those. FNGS never falls below the 20EMA, and not an ATR below before we hit our objective on July 14th. Here we take short-term profits of 9.5 R on the first trade and 3.94 R on the second trade for around +13.2R after fees and commissions.
Ideally, we want to trade the first trade after the base breakout that holds above the 20EMA and above the approximate breakout point after the 5-week base breakout, and in a top RS instrument. After the first trade, the reward/risk declines. But if we still have very strong technical skills, we can take repeat trades. Although we don’t want too much of our capital in any one stock or vehicle.
We’ve attached our current Top RS ETF list. Take a look at past and current trades using a similar methodology. The key concept is that you only want to take short-term trades in the direction of the very strong trend, defined by being in a top RS vehicle that has just recently broken out of a 5-week+ length base and has at least 20% room to the upside to next monthly resistance. Or, even better, is making new all-time highs and therefore doesn’t have any resistance overhead (in which case we stick to our trailing stop).
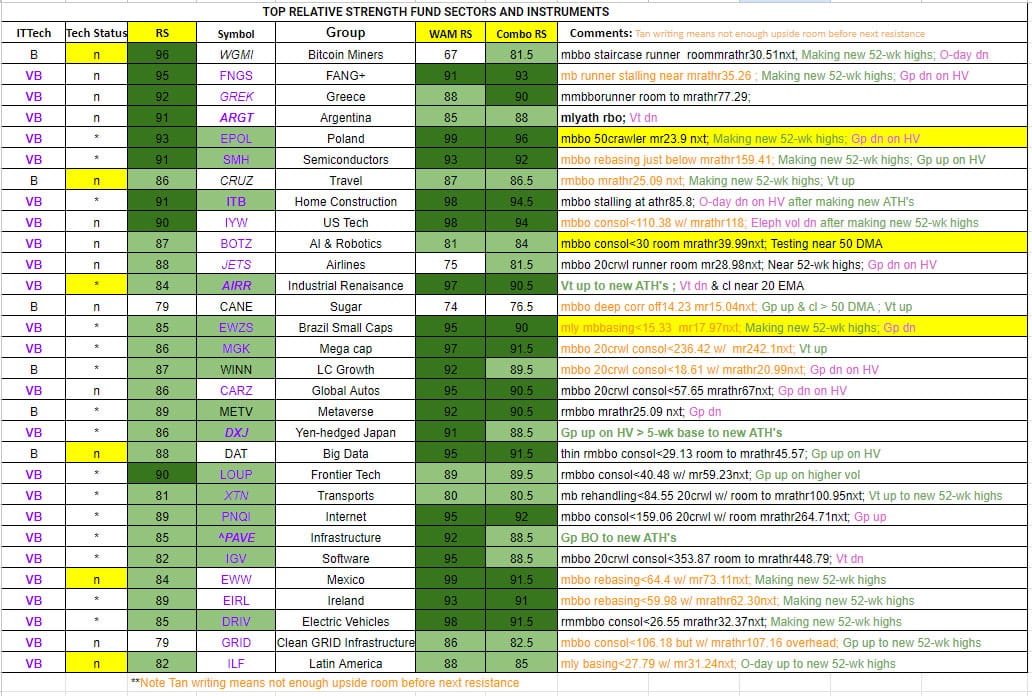
Super simple and doesn’t take much time to locate, particularly if you have a service like PSL or Reedstrader that compiles the list of vehicles for you that you then screen further for your trading strategy. You’re only trading runaway trends that have broken out higher and are holding over the 20EMA after the breakout, illustrating that they are still running. You’re watching overhead resistance and avoiding trades where resistance is too close. You’re keeping risk low by only trading tight technical consolidation patterns where you ideally have 5 to 1 or at least 3 to 1 reward-risk ratio in the trade. You’re looking for shorts as well as longs, using the same methodology in reverse. Here you got 13.2R in about 2 months, which is about 2/3 the rate to shoot for if you are a professional trader (10R+ a month). But, it’s only trading one vehicle, and you will trade many vehicles with the same attributes as opportunities provide. It’s also an over 50% annual rate of return that you can repeat again and again in both market directions. When you’re wrong, you lose 1R, but when you’re right, you make 5 or at least 3R. You’re trading with the trend, so you should average at least 50% reliability over the long run, and with further tools we teach, you can do much better in terms of both reliability and reward/risk. If you can’t find at least 3 to 1 trades and mostly 5 to 1’s to trade in either direction, wait until you do and don’t trade. You only trade runaway trends in this strategy, which keeps your drawdowns low and your profits high.
Once you get some experience, success, and profits, you can move to our Top RS/EPS stock lists too, and you could use the same screens for trading forex and futures as well.
Allocate by risk. In other words, risk 1% or 2% max of your capital from entry to ops to determine your size. So, for the first trade with 0.75 points risk, if you had a $100,000 account, you would trade 1300 shares. Your risk would be around $1,000 (1%) from entry to ops if hit, and your profits would be 5.75% of your account.
Here’s a quote from one of our student traders after researching all the trades that could have been taken from 2022:
“I found 600 awesome trades in 2022 alone (150 longs/450 shorts) [from the lists taken from rtds]. I defined awesome trades as those that have a 30% return (my max OPS% is 3%, so essentially, all 10R+ trades) or 15%+ return (5R+) in less than 30 calendar days.”
This trader found literally hundreds of 10R+ trades throughout the year, low drawdowns, and consistent returns in a very tough negative market year.
Here’s another simple concept and principle that ANY trader can use to cut risk and improve return.
It doesn’t matter whether you’re a short-term trader, an intra-day trader, a swing trader, an intermediate-term trader, or a long-term investor. You want to be on the lookout for ways to cut your risk and drawdowns and improve your R’s and total returns.
Most traders can accomplish an improvement in returns and slash their drawdowns at the same time from any strategy or approach they are using by optimizing tax reduction strategies that they integrate into their trading and investing. It’s a magic key to boosting the profits you keep with extremely low risk if done correctly.
Many investors and traders can garner significant tax benefits from setting up key retirement structures and using them to maximum benefit. Most investors and traders can also benefit from cutting the amount of taxes they pay on investments beyond their retirement accounts.
For example, did you know that you can put as much as $147,000 a year, pre-tax, into a Solo IRA and then have your IRA or retirement structure invest into an LLC that will allow you to trade nearly any strategy in it without tax (short-term trading, options, futures, forex, cyber-currencies, etc)? We work with one of the top IRA specialists in the US who knows how to get all these elements in place. In our Taxes for Traders Workshop, we can also show you backdoor Roth conversions and a number of other tools, and how to put these things together. And if you’re from the EU, or Canada, or Australia (or most places on the globe) we have structures for you that do similar things, often with lower costs and hassles.
Now, for many people, just figuring out how to optimize retirement structures and how to trade within them to both slash taxes and provide asset protection is a major game-changer.
But most investors and traders also have capital that they have already paid taxes on, which they are trading with. Many are paying short-term trading tax rates or income tax rates, along with state taxes on the money they make trading. We work with one of the top tax attorneys in the United States on a number of structures that can slash your tax bill to 10.5% or even lower with your after-tax trading money, and that provide asset protection to boot.
Our goal is to give you a double-barreled shotgun against paying too much tax and having your assets vulnerable to lawsuits, judgments, or other vulnerabilities you face if your assets are not in a protected structure of some kind.
Regardless of whether you are a short-term trader, a long-term investor, or anything in between, figuring out how to minimize the taxes you pay can be an incredible benefit to you!
If this article has opened your eyes to just how powerful a few key principles can be in transforming your trading results, imagine what you could accomplish by going deeper. Whether it’s mastering short-term trading strategies, learning how to identify and ride runaway trends, or optimizing your tax and retirement structures for maximum efficiency and protection, we’ve designed our workshops to give you the knowledge and tools you need to succeed. These are hands-on, practical programs that take the guesswork out of trading and wealth-building. Explore our workshops today and take the next step toward elevating your trading, maximizing your profits, and protecting your wealth.