Short Term Rally or More? By, D. R. Barton, Jr.

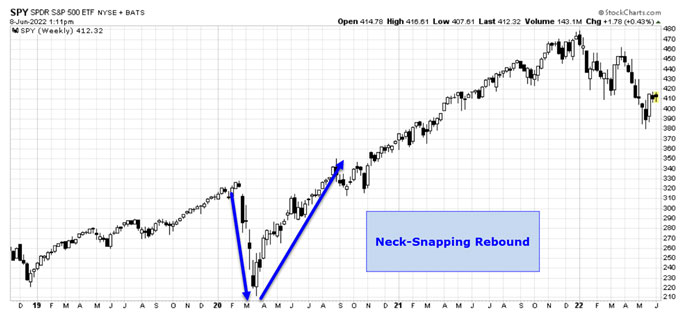
Just some quick thoughts today! The S&P 500 has managed what, at this stage, can be called a bear market rally of between 9% and 10%, including a 6.6% pop the last week of May. Many traders and investors are longing for the historically rapid push we saw after the March 2020 lows:
An analyst’s note from Stephen Suttmeier, out of Bank of America, earlier this week gave three conditions for this rally to continue. It was a bold enough call for us to take a look at each one to see if we can agree or not with his analysis.
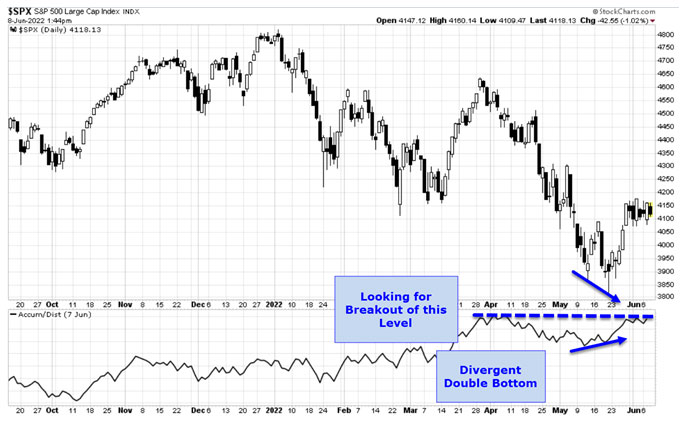
1) A breakout of the Advance-Decline (A-D) line. He used an A-D line of the most active stocks so he could show something proprietary, but we’ll use a standard A-D line. Also, note that the A-D line has a divergent short-term double bottom.
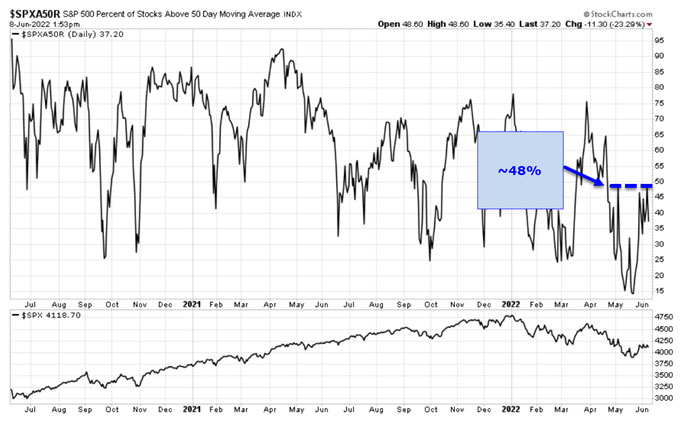
2) Next, he was looking for the percent of S&P 500 stocks trading above their 50-day moving average to break out above the ~48% resistance level on this chart. I can agree wholeheartedly with his reasoning here. Without some broad, intermediate-term upward momentum, the rally can’t be sustainable.
3) And lastly, he was looking for a long-term volatility to contract relative to short-term volatility. This one was quite reasonable as well.
I’d love to hear what you’re looking at to act on the market’s next leg up OR down. As always, please send me your thoughts and comments. I always love to hear them and I answer as many as I can! Email them to drbarton “at” vantharpinstitute.com
Great trading and God bless you,
D. R.